1. Introduction
Products are often purchased with little or no prior information about them; in the case at hand, we may like to try a wine that we have never tasted before. Market research shows that this decision is usually made relatively quickly (i.e., from a quarter of a second to a few seconds) and without much information search other than a cursory glance [
1].
Advances in the field of attention and the importance of attention for marketing now make it possible to understand the preattentive and attentive mode of the user. The first stage indicates where the first fixations are directed, and the second, where more specialized processing takes place. Therefore, for digital marketers, it is essential to activate the consumer’s preattention mode [
2]. This mode of attention can be achieved by shaping the visual elements that make up the ad design. Proper execution and careful design can help to achieve successful promotional strategies for companies [
3]. The precision in selecting the elements to be included in the ad can determine whether or not the consumer’s attention is captured. In addition, these elements will influence where attention will be directed within the ad [
4].
Today it is possible to know the place where the consumer directs his attention, thanks to eye-tracking technologies. Through this technique of recording eye movement, it is possible to know in depth the consumer’s behaviour while browsing the Internet [
5]. The knowledge and correct interpretation of this information can help marketing experts to apply new techniques that improve the interaction and transactions between customer and company [
6]. In e-commerce, it is possible labels on the bottles do not allow the correct visualization of the wine. Other times the glass bottle is opaque, or it is presented in a cardboard box with different colours, which hides the liquid content. The very nature of online commerce prevents the perception of intrinsic attributes and sensory qualities of the wine (e.g., taste, texture and aroma, and the actual tone and clarity). Thus, this particular situation of buying a bottle of wine is a paradigmatic example of decision making that is guided by visual cues [
7].
Statistics report that 92.08% of desktop search traffic in Spain originates from Google, i.e., out of every 100 words searched, 91 are performed in Alphabet’s search engine [
8]. From the above data, it is clear that most Internet users use Google to conduct their searches. These can be grouped according to the intention that users may have a priori [
9]. Specifically, we will focus on multimedia searches. The user will focus their attention almost exclusively on the image and not on the rest of the information on the results page [
10]. This type of search has replaced the search for information as the most common purpose of Internet use [
11].
Research on the antecedents of wine purchase is based on self-reports that ask participants to evaluate intrinsic and extrinsic cues according to their opinions and beliefs [
12]. However, little importance has been given to the influence of visual attention and its relevance in driving unconscious behaviours, which ultimately drive the autonomic nervous system and are very difficult to control [
13,
14]. More research is needed to identify the influence of packaging on attention and improve purchase potential [
15].
Given that consumers generally cannot taste the digital medium’s product, the perception of its attributes and, therefore, their final purchase decision is usually based on the product’s extrinsic signals [
16]. These cues are perceived visually through the advertisements that companies use and allow the consumer to form an attitude towards the product. The consumer’s attention towards the advertisement will determine the click on the banner or, on the contrary, that it is ignored [
17,
18]. Generally, consumers’ attention is directed to their choice’s essential elements [
19]. Different works show that attributes with greater importance for the decision-maker receive more fixations [
20,
21].
Most published studies have shown that the wine bottle label provides information about the sensory attributes and quality of the wine it contains [
5,
22]. However, we did not find any study that analysed the fixations made in ads placed in the Google search engine, comparing the elements of the ad, type of presentation (pack vs. individual bottle) and colour of the bottle (with label vs. transparent), which manage to capture the consumer’s attention to a greater extent. In most current wine ads, these characteristics are used interchangeably without considering the opportunities that optimizing these messages can provide to increase the click-through rate and, therefore, the conversion rate. Current search engine optimization (SEO) and search engine marketing (SEM) techniques allow the design of strategies in banners and advertising spaces that improve website traffic [
23]. The ability to personalize messages using methods such as data science or eye-tracking provide wine marketers and digital marketing companies with an opportunity to identify consumer characteristics and improve the ROI of digital campaigns [
24]. Companies collect data from their online browsing and analyse important aspects, such as digital habits and behaviours [
6].
Some work indicates that there is a skills gap among industry professionals to interpret the data [
23,
25,
26]. This work, facilitates knowledge, skills and a way to strategically and operationally apply data from eye tracking, information that allows measuring the advertising effectiveness of banners [
4]. Therefore, together with biometric information offered by eye-tracker derived data to consumer research, in the digital marketing environment, analytical techniques should be used to develop more accurate and personalized strategies [
27]. Achieving effective communication campaigns, reduces advertising costs, facilitates decision making by marketing executives and wine marketing companies.
This research’s primary purpose is to analyse the advertising effectiveness of the message in Google, from the point of view of attention. To perform this analysis, an eye-tracking methodology was used. We consider the typical elements that make up current wine advertisements. Among the most common pictorial elements employed in ads for this type of beverage, we find ads that feature an individual bottle (vs. pack). In addition, we analyse the attention capture achieved by a transparent bottle (vs. labelled).
2. Theoretical Framework
2.1. Effectiveness of Messages in the Digital Media
Since the early days of the internet, there has been an important debate on how to measure advertising effectiveness [
28]. Some works have analysed digital marketing strategies by studying data science techniques [
29]. Others have analysed user behaviour (e.g., click-through rate) [
30], user information processing (e.g., attention, recall) [
17], and characteristics related to message elements that generate particular attitudes towards the advertisement and influence purchase intention [
31].
In this context of large datasets, companies primarily want to know (a) how to analyse performance metrics based on data science, (b) how more effective online advertising strategies can be achieved and (c) how consumers process commercial messages [
3,
21]. During the last two decades, different methodologies have been used to solve these problems based on data science [
24], cognitive neuroscience and psychophysiology [
32,
33], biofeedback and facial coding meters [
34] or eye tracking, [
5,
35,
36] among others. These methodologies can be used to measure marketing efforts by measuring nonverbal bodily responses. From this “neuromarketing” approach, applying these methodologies opens an infinite number of possibilities to study the attention that consumers pay to online advertising and marketing in general [
18].
While some authors advocate the use of heuristic measurements to assess user behaviour, others opt for the use of experimental data focusing on users’ cognitive processing after exposure to banner advertising [
37], eye-tracking methodology [
38] or self-assessment tools, including surveys, among others. The data collected by the eye-tracking methodology is raw data, namely capture data that includes measurements and observations designed to gather information from advertising banners [
39].
More recent studies used eye tracking to analyse advertising effectiveness by measuring attention paid to advertisements solely through eye fixations [
40]. These fixations can be extracted by eye-tracking, a technique that has gained utility in different consumer-related disciplines and, more specifically in studies related to the online world, for example, to quantify the effectiveness of advertising banners. In particular, this technique provides accurate information on the duration and number of fixations, allowing researchers to recognize viewing patterns [
2]. The present study adopts the inductive reasoning approach in which researchers compare large datasets from the recording of eye metrics to identify which ad is more effective without designing an explicit model.
2.2. Attention to Google Ads
Traditionally, the list of websites retrieved by a Google query shows information sorted by the cost paid for the searched word (sponsored links with a description located at the top or on the right side of the screen next to an image), by the relevance of the content and by other criteria based on complex algorithms. Logically, users’ attention to search engine results pages (SERPs) is strongly influenced by the position, visibility and design of the search results’ ads. Thus, users prefer the first pages displayed [
41] in the so-called “visible area” of the SERP, i.e., results visible without scrolling [
42,
43]. Further, the displayed results encourage consumers to click, due to the size, the graphic design [
44] or the elements that compose the advertisements [
5].
Previous literature highlights the great importance of positioning among the first positions in the search engine because the consumer considers these results more relevant and reliable. They also determine the fixations of users [
45,
46]. Currently, ads that appear after performing a desktop query on Google are shown shaded within a frame. However, this varies continuously [
47], with a trend towards more subtle labelling [
43], which in turn leads to an increase in the number of ad clicks [
48]. Specifically, shopping ads displayed on desktop computers show a button with additional information about how ads are generated [
49].
Most search engine users cannot distinguish advertising in organic results from paid adverts [
50]. Typically, users click on the first ad [
51]. Although Google gives a significant similarity to text ads and organic results. In the case of side ads with images, the search engine indicates at the top right that it is an ad. The ability to capture the selective attention of consumers, will depend on the content of the advertisement designed by advertisers and not on the relevance or trust of users [
48]. Although most eye-tracking studies have shown that visual attention on desktop ads is higher when they are at the top of the SERP [
5,
52,
53]. Because the results are reviewed from top to bottom [
54]. Specifically, the user, when viewing a web page, focuses mainly on the top and central part, and their eyes generally move from left to right [
55]. This causes the lower and right side of the results page to be the area that receives the least attention. Google is aware of this fixation pattern and leaves this space blank on all its pages.
In addition to the aspects already mentioned, another factor affecting viewing behaviour is also the type of task assigned to the participants. Some authors support that goal-oriented browsing (vs. exploratory or free browsing) generates less advertisement recognition in browsing [
56]. Although these results are not conclusive, for example, if the goal is transactional, ads receive more visual attention [
53]. That is, consumers move their eyes, intending to obtain information about the product they are looking for and stop when they see something that captures their attention [
55]. It is where the importance of ad design comes. The different elements that make up the ad or banner ad affect viewing behaviour when searching on mobile devices [
57] and desktop computers [
58]. In addition to ad placement, banner blindness (ignoring paid ads in a SERP) will determine the recall that the banner generates [
5], the user’s attitude towards advertising and their selection behaviour [
59].
In summary, ads also attract a lot of visual attention on desktop computers. In particular, this holds for top-ranked search results. Finally, ads are clicked more frequently on mobile devices.
2.3. Attention to the Transparent Product vs. Label
The shape of the bottle is not the only element of the message that can attract attention. Consumers may direct more attention to one bottle than another due to different aspects [
60]. Prominent among these elements is the colour of the bottle. The importance of colour arises from its influence on perception since it is the first “signal” perceived when looking at bottles [
61]. The work of Monteiro, Guerreiro and Loureiro [
62] suggests that, during the purchase process, the attention paid to a bottle is a determinant of individuals’ purchase intentions. Traditionally, wine bottles have used an opaque colour given that it allows the beverage to be protected from environmental contamination, light and other influences [
63]. Developments in packaging techniques allow today to design transparent containers where the product is visible. Numerous companies market transparent bottles and include them in their communication campaigns. Advertising messages can incorporate transparent bottles in their design, although it seems to be unclear which type of packaging captures the attention of consumers to a greater extent. The literature has documented that packaging transparency can influence trust and product quality [
64]. When the package content is visually appealing, transparent packages are more trustworthy and generate higher purchase intent [
65,
66]. The same is not valid for cooked vegetables, i.e., if consumers do not appreciate the visual appeal, purchase intention is reduced [
67]. This finding has been demonstrated in recent research that looked at the packaging for granola, pasta, salmon, and chocolate, showing that when the packaging is transparent and allows the product to be seen, consumers are more likely to consider purchasing [
68]. However, this work did not employ any attentional measures.
The packaging manipulation performed in the research of Simmonds and Spence, [
69] suggests using transparent packaging where the product is visible inside. This seems to influence attention capture. Using the eye-tracking technique, recent work by Włodarska et al. [
15] studied different apple juice packaging. The authors examine glass bottles and plastic cartons. Although the study indicated the areas that attracted consumers’ visual attention to a greater extent (brand name, nutritional data and information about the type of product), it did not analyse the influence of the colour of the packaging. To investigate the effect of packaging features on consumer attention, Orquin et al. [
70] suggest using eye-tracking. This technique was used in the research of Piqueras-Fiszman et al. [
71] demonstrating that some elements of the product packaging can serve to attract visual attention. Considering the above, it is logical to think that, including in wine advertisements, packaging with a transparent design will attract the gaze patterns of consumers towards those advertisements, although previous literature on wine advertisements does not clarify which type of packaging is most effective from the point of view of attention.
2.4. Attention to the Individual Product vs. Packs
Previous research defines the pack as, the sale of two or more separate products in a bundle. Packs integrate two or more products and improve the price offered individually (for example, a PC and software) [
72]. Besides, their acquisition brings value to the consumer who gets more product quantity for a lower price. In this paper we study the attention paid to advertisements that show the product individually (in a bottle vs. packs). The interest of knowing the differential aspects of both presentation and design lies in their frequent use. In the messages used by wine marketers, it is widespread to find ads that show individual bottles and others that offer packs of bottles.
Research studying packaging design indicates that it is likely that the size of the package influences the attention of consumers [
73]. Online communication campaigns call for including product images with different formats. The package’s typology and size enhance the visual information provided to the user and can direct their attention [
60]. Capturing attention will facilitate the visual evaluation of the product presented in the ads and allows researchers to examine the information processing that users perform on the different ads. These presentation formats influence consumer evaluations [
73].
In online commerce, the advertisement showing the individual product presentation replaces possible haptic evaluations and influences consumer perceptions [
74]. The impossibility of touching the product increases the importance of the forms of presentation of the good. Research on shape contrast has mainly focused on consumer expectations, showing that products that deviate from the prototypical shapes of the traditional product category attract more consumer attention [
60,
75]. Among other elements, the height of a package has been analysed, suggesting that it simplifies volume judgments [
76]. Tall packages are perceived as having more product than shorter packages [
60]. Previous studies indicate that consumers use only one dimension to direct their attention [
61]. However, focusing on a single dimension seems inconsistent with research suggesting that people pay attention to objects at a holistic level rather than to a particular dimension [
60]. Visual attention is directed to objects as a whole rather than to areas of interest in a visual field [
77,
78].
Using self-report techniques, Folkes and Matta, [
60] comprehensively compared an irregularly shaped container with another container of similar size. To confirm that size influences perceived attention for similarly shaped packages. Subjects viewed two cans with different volumes (16 oz vs. 12 oz) and the labels masked with white paper. All participants stated that the 16 oz can could attract their attention more than the 12 oz can. This bias is due to the covariation of attention directed to a stimulus with its size. Through experience with various stimuli, people have probably learned that they can comprehensively and simply assess which of two shapes is more prominent when the difference is significant [
60]. One perceptual sensation that covaries with such size evaluation is differential attention: large shapes generally attract attention more than small shapes. For example, the larger the ad, the more likely it is to be seen [
79]. We wonder what will happen when the ad is the same size and what varies is the package’s shape. According to previous literature, large packages are also likely to attract more attention than small packages, as a rule of thumb [
60].
Shape properties can, therefore influence the attraction of attention to a product advertisement. In addition, attention can intrude on size judgments because attention can be directed to objects automatically, without the consumer having to consciously deliberate about them. An individual may not even realize that he or she compares packages in terms of their attention-getting abilities because comparative evaluations are so ingrained that they are spontaneous [
80].
Derived from all of the above, we posed the following research hypotheses:
Hypothesis 1a (H1a). Ads featuring clear bottles of white wine (vs. bottles with white wine label) will engage consumers earlier and longer.
Hypothesis 1b (H1b). Ads featuring clear bottles of red wine (vs. labelled bottles of red wine) will engage consumers earlier and longer.
Hypothesis 1c (H1c). Ads featuring clear white wine packs (vs. white wine labelled packs) will engage consumers earlier and longer.
Hypothesis 1d (H1d). Ads featuring red wine clear packs (vs. red wine labelled packs) will engage consumers earlier and longer.
Hypothesis 2a (H2a). Ads featuring clear packs of white wine (vs. clear bottle of white wine) will engage consumers earlier and longer.
Hypothesis 2b (H2b). Ads featuring clear red wine packs (vs. clear red wine bottles) will capture consumers’ attention earlier and longer.
Hypothesis 2c (H2c). Ads featuring white wine labelled packs (vs. white wine labelled bottle) will engage consumers earlier and longer.
Hypothesis 2d (H2d). Ads featuring packs with a red wine label (vs. bottles with a red wine label) will engage consumers earlier and longer.
3. Materials and Methods
3.1. Fieldwork
Fieldwork was carried out at the University Institute for Sustainable Social Development of the University of Cadiz, Spain. We recruited 60 individuals (30 men and 30 women) through quota sampling. All over 18 years of age, the minimum legal age at which a person can legally purchase and consume alcoholic beverages in Spain. We used email and telephone to contact each participant and financially compensated their time. The average age of the wine consumer in Spain (44.5 years) was also taken into account. Following the recommendations of Muñoz-Leiva et al. [
5], we selected a balanced sample, composed of 50% of participants aged between 18 and 44 years and the other half were 44 years or older.
The assigned task was to search for a wine to buy. Each participant was shown the Google search result. In each scenario, two of the eight designed wine ads were included in the Google product listing ads (right side of the computer screen).
The International Telecommunication Union recommends simulating a home environment for such experiments. The room where the test was conducted was isolated from outside sound and had ambient lighting of 200 lux. We recorded the pattern of eye fixations of each participant using an infrared video eye-tracking device, Tobii Pro. This device samples the corneal reflection and pupil movements of each participant at 60 Hz. The system has a spatial tracking accuracy between 0.5 and 1 degree of visual angle, well suited for information systems research. Calibration was performed using a nine-target grid to optimize spatial tracking accuracy, and the data were processed with Tobii Pro Lab v. 1.111 software.
3.2. Experimental Stimuli
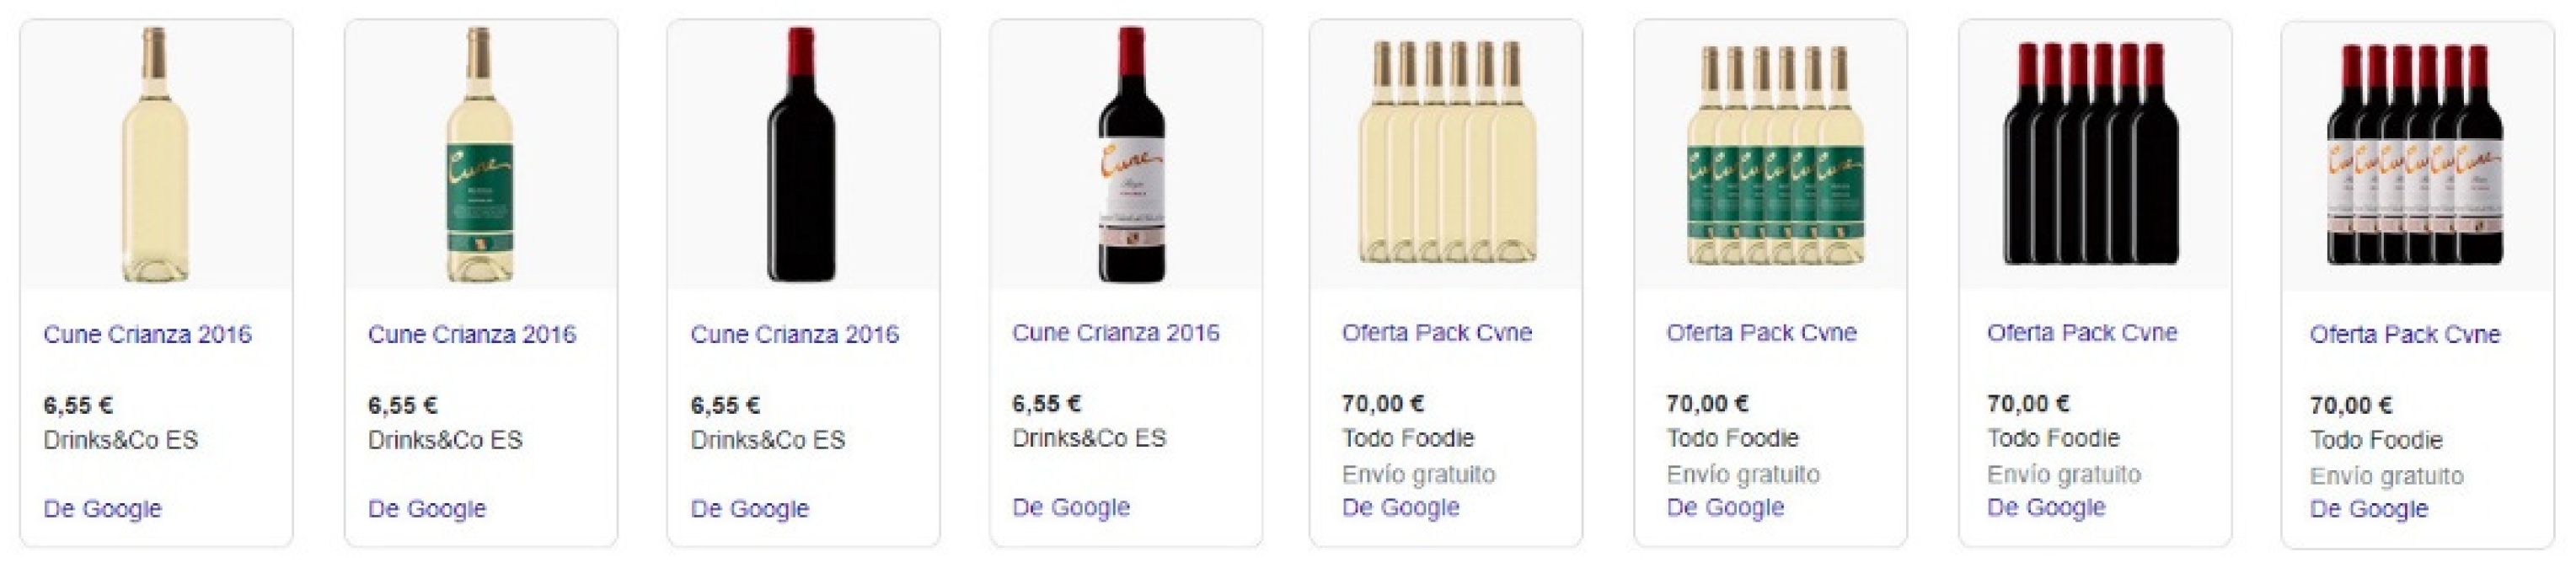
The images included in the ads represent the elements frequently used in online wine advertising. Each experimental ad contained a different image (see
Figure 1). Following the methodology used by Wedel and Pieters [
81], we narrowed down areas of interest for the eye-tracking study, differentiating between format (single bottle vs. pack of bottles) and labelling (unlabelled vs. labelled). The result of the combination of these elements were four ads: (i) individual bottle without label (BT) highlighting the extrinsic characteristics of the wine; (ii) individual bottle with label (BE) allowing to see the label, the brand and some characteristics of the content; (iii) bottle pack without label (PT) composition formed by six bottles where it is possible to see the colour of the wine; (iv) bottle pack with labels (PO). These conditions were replicated for white (vb) and red wine (vt) (see
Appendix A, experimental ads used).
3.3. Experimental Design
The experimental design consisted of simulating an online wine purchase where all participants viewed search results from the Google browser. We created four experimental groups (EG) of 15 subjects each. We counterbalanced gender and age and assigned participants to each group as they arrived in the lab.
Under these conditions, the experiment was counterbalanced, i.e., the number of subjects was the same for each experimental group according to the type of viewing order. With respect to an unbalanced model, our balanced model offers several advantages, such as: (1) a more simplified computational process, (2) the resulting contrasts are more robust, and (3) it minimises the false negative rate in the test for differences of means.
EG1: (BTvb vs. BEvb + PTvb vs. PEvb) vs. (BTvt vs. BEvt + PTvt vs. PEvt) and vice versa.
EG2: (PTvb vs. PEvb + BTvb vs. BEvb) vs. (PTvt vs. PEvt + BTvt vs. BEvt) and vice versa.
EG3: (BEvt vs. BTvt + PEvt vs. PTvt) vs. (BEvb vs. BTvb + PEvb vs. PTvb) and vice versa.
EG4: (PEvt vs. PTvt + BEvt vs. BTvt) vs. (PEvb vs. PTvb + BEvb vs. BTvb) and vice versa.
Given that the order of stimulus presentation can influence preference evaluations [
82]. The experimental design was established to mitigate the effect of the order of stimulus presentation and to ensure adequate internal validity, based on controlling for the impact of the independent variables. In addition, it allowed researchers greater control over the research setting [
83].
Each test began with a screen indicating the experiment’s instructions, which displayed the following message (Next, you will see the first page of Google results when we searched on different days for the term: “buy wine”). Ads were then displayed, two by two, according to the sequence assigned to the EG to which each participant belonged. Between each scenario, we included a baseline, showing similar search results. The subject navigated from one scenario to another as he/she saw fit, i.e., we did not consider time pressure.
3.4. Selection of Areas of Interest (AOI’s)
Testing participants’ attention to the different stimuli, the eight advertisements were divided into several areas of interest (AOI’s). We manually narrowed down the regions comprising the single clear bottle (no label), the labelled bottle, the pack of clear bottles (no label), and the pack of labelled bottles (see
Appendix B). The selection of AOI allows us to correctly identify all fixation measurements performed within them.
3.5. Eye Movement Analysis and Statistical Analysis
Eye movements comprise two components: fixations and saccades [
84]. Fixations are the periods during which a person’s gaze remains stationary. Fixations occur when the eye stabilizes for 200–300 milliseconds [
85]. Saccades are rapid eye movements between fixations, lasting 20–40 milliseconds, in which specific locations in a scene are projected onto the eye. They are the fastest movements made by the human body, and it is estimated that the average person makes 70,000 such movements each day.
Specifically, analysis of fixation patterns was conducted using IBM SPSS Statistics v. 22, based on raw eye coordinates derived from Tobii pro Lab. software and other fixation metrics data. The measures used in the study were: time to first fixation (TFF), a number of fixations made prior to the first fixation in the area of interest (NP), mean fixation duration in the AOI, fixation count (FC), total duration of fixations in the AOI (TFD).
Once the different ocular measures were taken for each stimulus, a Wilcoxon test for related samples was performed. In this way, we compared the effects of manipulating the independent variables (format type and labelling) generated on the dependent variables (eye-tracking metrics).
4. Results
Next, we analyse the differences in visual attention patterns paid to labelled (vs. unlabelled) ads (see
Table 1 and
Table 2) through visual metrics such as TFF, FB, FD, TFD and FC.
The results for white wine show that ads showing an unlabelled bottle first capture consumer attention (TFF = 8.25 milliseconds, FB = 33.65 fixations). However, ads showing a bottle with a label get more attention (TFD = 6.42 s, FC = 31.66 fixations). It allows us to partially contrast our H1a in terms of attention capture (TFF and FB) and duration measured in terms of (FD). Although we cannot wholly refute it given the results of (TFD and FC).
The ads showing individual bottles of red wine the results indicate that the unlabelled bottles manage to attract the consumer’s attention faster (TFF = 8.94 milliseconds, FB = 34.25 fixations). Although, this attention is maintained longer in the ads with labelled bottles (TFD = 3.17 s, FC = 12.06 fixations). This result contrasts H1b, in terms of earlier attention capture (TFF and FB) and partially in terms of attention duration (FD).
In the case of ads showing packs, those that use several bottles of white wine without labels, manage to capture the user’s attention earlier (TFF = 6.86 milliseconds, FB = 27.38 fixations), the average duration in this type of stimuli is also longer (FD = 0.29 milliseconds). Although ads with packs of white wine bottles using labels manage to maintain attention for longer (FDT = 6.99 s, FB = 34.78 fixations), the average duration in this type of stimuli is also longer (FD = 0.29 milliseconds, FB = 34.78 fixations). The findings reached here allow us to contrast H1c, concerning faster attention capture (TFF and FB) and partly concerning attention duration (FD) on the ad.
Ads using packs of unlabelled red wine bottles attract the attention of the wine buyer sooner (TFF = 6.10 milliseconds). Likewise, this type of ad gets more attention in terms of time and frequency (FD = 0.26 milliseconds, TFD = 7.13 s, FC = 14.31 fixations). This finding partially contrasts H1d in terms of faster attention capture (TFF) and totally contrasts the hypothesis in terms of attention duration (FD, TFD and FC) to the ad (see
Table 3).
Once the colour was analysed, we studied the influence that the presentation format (individual bottle vs. pack) included in the ad has on the attention measures. As in the previous case, we also differentiated by type of wine.
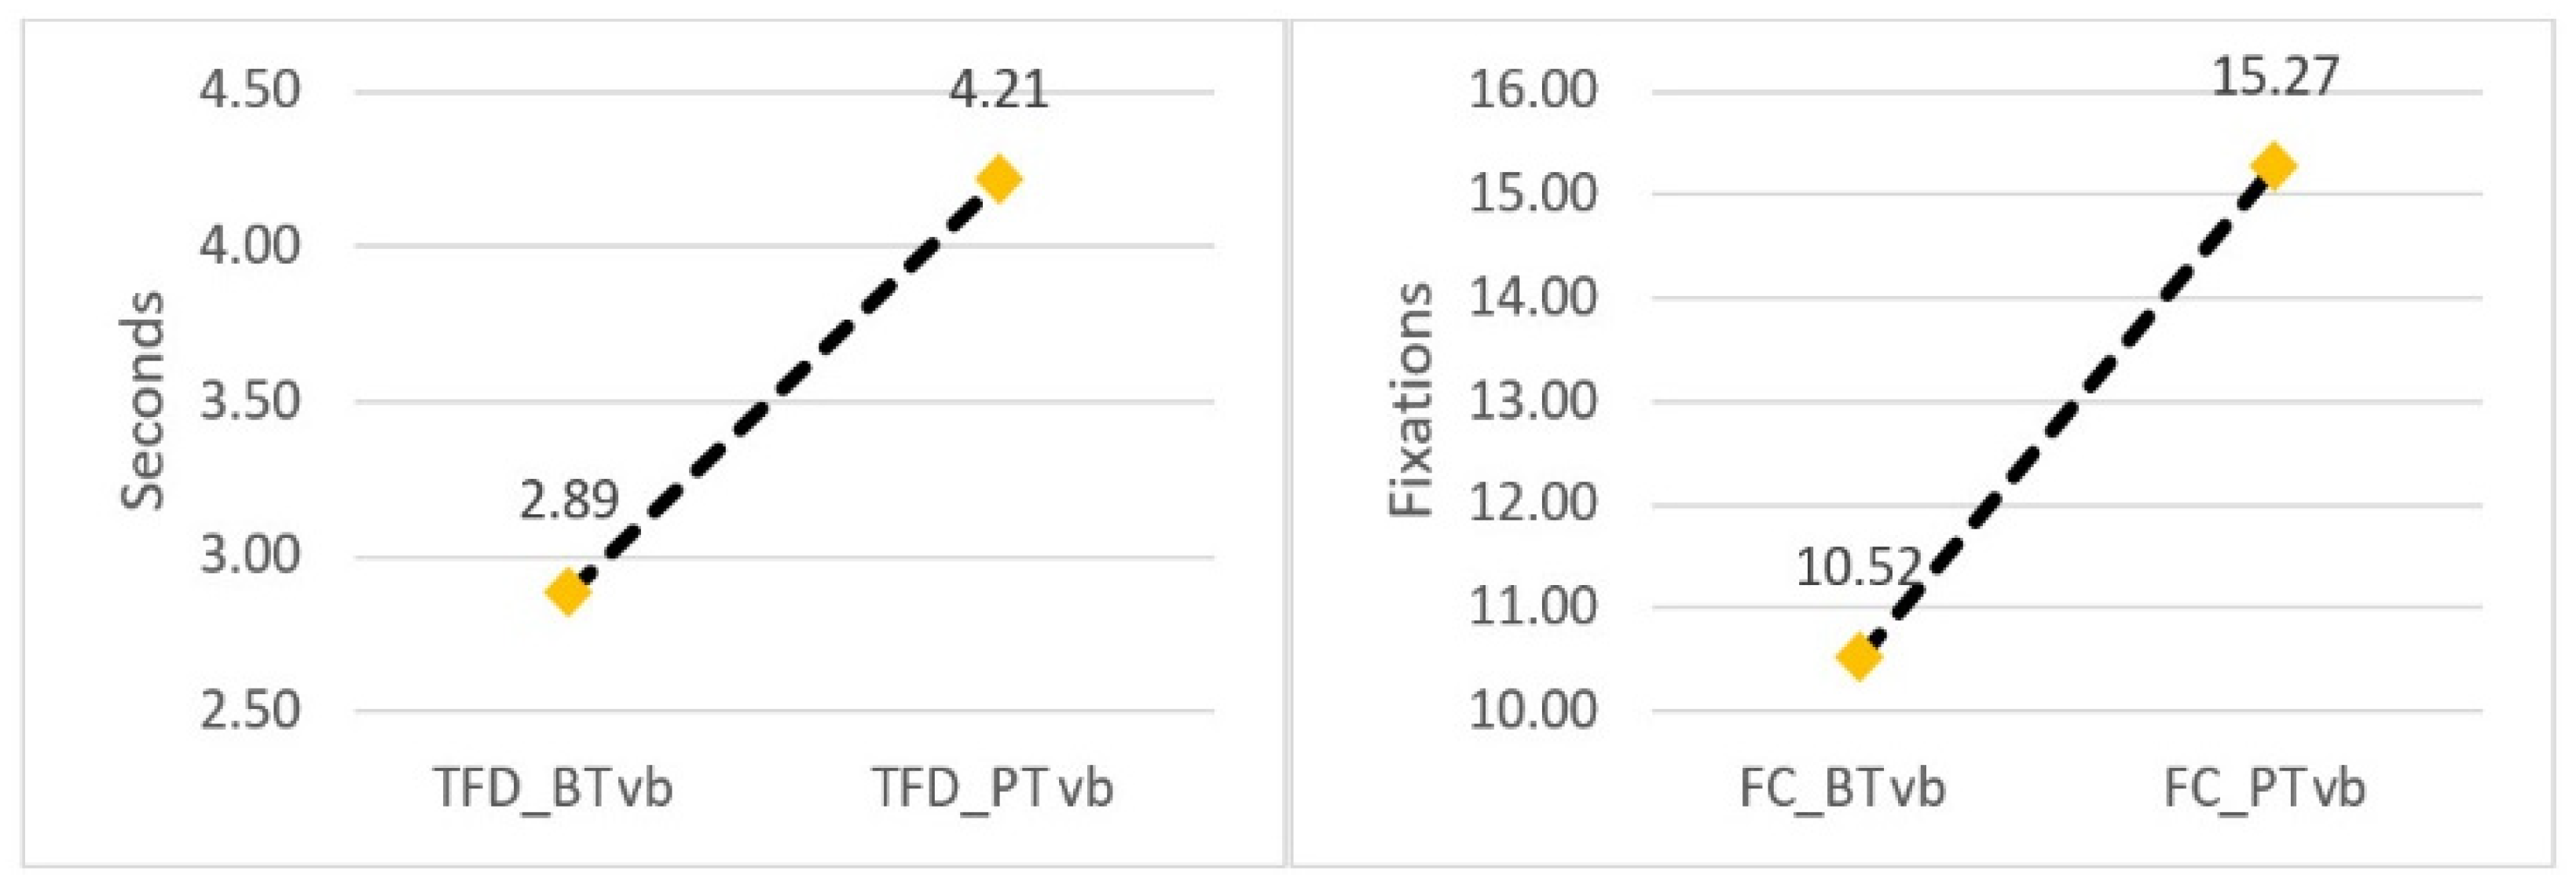
Subsequently, we analysed the white wine ads using pack without label (vs. bottle without label). The results show that there are no differences in TFF (Z = −0.819,
p= 0.416), FB (Z = −1.158,
p= 0.247) and FD (Z = −0.488,
p= 0.625). However, we found differences in TFD (Z = −3.316,
p= 0.001) and FC (Z = −3.956,
p= 0.000). The time users spend looking at the ad showing a pack of bottles of white wine without a label (TFD_PSEvb) is greater than the time spent looking at the ad that includes a single bottle of white wine without a label (TFD_BISEvb). Similarly, the number of fixations on the ad showing a pack of bottles of white wine without label (FC_PSEvb) are higher than the fixations devoted to the ad with single bottle of white wine without label (FC_BICEvt). The result of this analysis partially confirms (for TFD and FC) our H2a, which posited that transparent white wine packs attract consumers’ attention longer. Below, we plot the marginal means of the measures showing these differences (see
Figure 2).
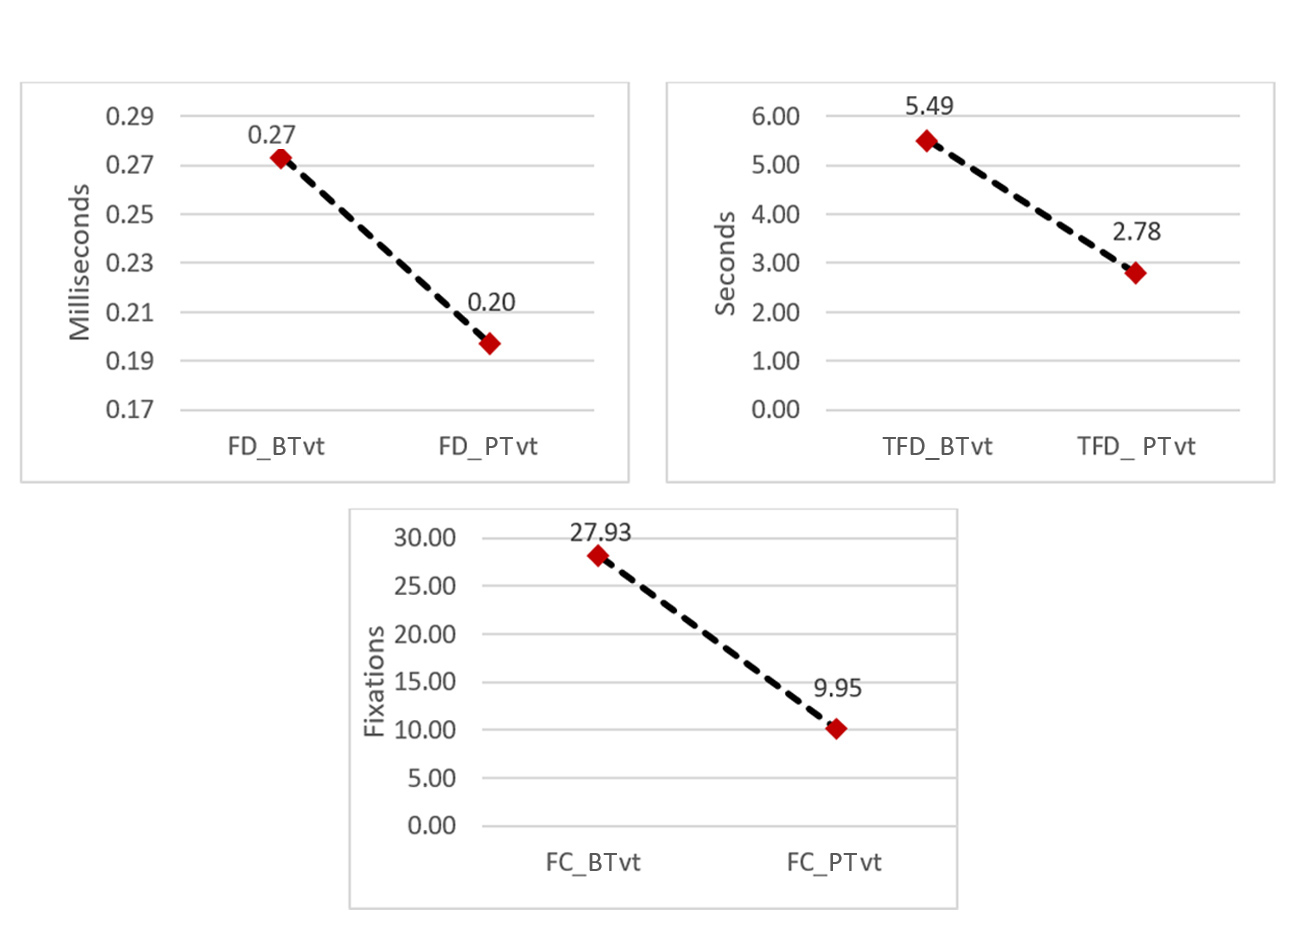
Continuing with the analysis, we checked the results in the case of red wine ads. The data show significant differences in all attention measures TFF (Z = −4.498,
p = 0.000), FB (Z = −4.406,
p = 0.000), FD (Z = −4.330,
p = 0.000), TFD (Z = −4.988,
p = 0.000) and FC (Z = −6.248,
p = 0.000). Specifically, we demonstrate that red wine ads showing packs of unlabelled bottles manage to capture consumers’ attention earlier (lower TFF and FB) than ads showing individual clear or unlabelled bottles of red wine. This would partly confirm our H2b. However, we cannot affirm that these packs achieve longer attention spans (FD, TFD and FC) given that the ads for individual bottles without labels perform better on these metrics (see
Figure 3).
Finally, we analysed the labelled pack’s effect (vs. labelled bottle) for both types of wine. In the case of white wine, we rejected our H2c. Although we found significant differences for TFF (Z = −2.197, p = 0.028), the results indicate earlier attention capture in the case of ads showing a single bottle ( = 11.35 > = 14.13). We found no significant differences in the remaining visual metrics.
In the case of red wine, we found differences in FB (z = −0.924, p = 0.000), FD (Z = −4.884, p = 0.000), TFD (Z = −5.676, p = 0.000) and FC (Z = −2.004, p = 0.045). Specifically, we partially confirmed our H2d, demonstrating that the packs with label, manage to capture (lower number of previous fixations, FB) before the attention of the users than, the individual bottles with label ( = 13.21 > = 49.16). In addition, they managed to attract attention for a longer time, in terms of average duration ( = 0.19 < = 0.26) total time in the bottle ( = 3.17 < = 7.13) and a higher number of fixations ( = 12.06 < = 14.73).
5. Discussion
The results obtained in this work demonstrate that the online purchase of a bottle of wine is a reflexive process that requires prior information processing and not simply a superficial glance. Consistent with the work of Gómez-Carmona [
4], our research found specific locations where consumers fixate their attention within advertisements. These results demonstrate that eye-tracking is a suitable technique to understand the unconscious behaviour of users, as well as reinforcing the work that uses this technique to analyse advertising effectiveness [
5]. The experimental manipulation used in the design of advertisements allows identifying the visual pattern and helps digital marketing experts to select the advertisement that presents the best visualisation metrics. According to Saura and Bennet [
6] this information about the company-customer interaction can lead to more successful marketing strategies, given the increased knowledge about the consumer. Alongside the use of SEO and SEM strategies that improve website traffic, our work supports the research of Palacios-Marqués et al. [
24] which suggests that identifying consumer characteristics can improve the profitability of digital marketing campaigns. We identify different challenges related to banner ad execution and design that focus on the analysis of user data in Google and the digital wine market. Similar to the work of Saura et al. [
23] our results suggest that companies can personalise their messages based on their customers’ preferences. Through eye-tracking it is possible to collect information from users, finding a multitude of data that can help predict both users’ behaviour and their actions in digital ecosystems [
85].
In contrast to the work of Danaher and Mullarkey [
57] our work demonstrates that, when advertising is linked to the task goal, consumers devote greater attention to advertisements. In addition, our results contrast with work that suggests using opaque packaging to market the product [
63]. Specifically, our work demonstrated better early attention in wine advertisements using transparent packaging where the intrinsic characteristics of the wine are displayed. Although previous literature indicates that package size influences attention capture, our results disagree with those achieved in Engeset and Opstad’s [
73] work, it is possible that, when analysing equivalent regions in size, the effect caused by quantity is lost, i.e., even if the ads show packs of bottles, the holistic evaluation of the ad showing packs of bottles attracts less attention than that of the ad showing an individual bottle. According to previous literature, ad attention capture is proportional to ad size Pieters and Wedel [
86]. In this case, the ad size is equal, although the bottle pack element is larger than the individual bottle element. Our results support previous literature in the attentional mode (TFD and FC), i.e., a larger element size (pack) requires more focused attention. This implies a more significant cognitive effort to understand the advertisement. Therefore, our results reinforce those achieved by Folkes and Matta [
60], suggesting that the larger the package is perceived within the ad, the more attention it receives.
6. Conclusions
The stages of preattention and attention allow us to divide our hypotheses into two parts and to conclude which stimulus captures attention earlier and which stimulus captures attention longer. The importance of this lies in the advertising objectives set for each campaign.
First, the study delved into ads showing a bottle of wine (white or red) with and without a label and partially contrasted the hypotheses (H1a and H1b) put forward. It may be due to the cognitive processing involved in interpreting the label’s syllogistic meaning and its relationship to the contents of the bottle. The attraction of the colour of the white or red wine is demonstrated, but the label causes the consumer to devote greater attention to understanding the message.
Secondly, the paper analysed ads showing packs of wine bottles (white or red) with and without a label. The results partially contrast the hypotheses (H1c and H1d). We demonstrate the relevance of the colour of white or red wine to capture user attention faster with ads that employ packs. Although ads that include labels on their pack achieve higher cognitive processing, typical of a reading task over the textual information on the label.
Third, it is striking to find no differences in the first stage of attention (TFF and FB) when contrasting our H2a concerning white wine. According to previous literature, ad attention capture is proportional to ad size [
87]. In this case, the ad size is equal, although the bottle pack element is larger than the individual bottle element. Our results support previous literature in the attentional mode (TFD and FC), i.e., a larger element size (pack) requires more focused attention. This implies a more significant cognitive effort to under-stand the advertisement.
In red wine (H2b), the larger element size included in the ad does achieve faster attention capture. However, it is the individual form of presentation that generates the most thought. Previous wine shopping experience may determine or is influencing the greater attention paid to the bottle included in the ad. Given that red wine has the highest percentage of online purchases [
88], this factor experience in wine purchases may motivate that greater interest in the individual bottle.
In the case of red wine, ads that include a pack with a label manage to capture users’ attention earlier and longer (H2d). It is possible that the label information on the packs is perceived, although diffuse but clearer than the information on the label of the individual bottle. It is achieving better results with the advertisement, from the attentional perspective.
7. Managerial Implication
Designers of advertising messages that aim to capture attention more quickly with their wine ad can insert an individual bottle without a label. In this way it is possible to gain the consumer’s preattentive mode in Google ads.
Wine marketers aiming to achieve sustained attention in their wine ad can insert a pack with a label; this may trigger the user’s attentive mode, who will process the Google ad more thoroughly.
Taking together, our findings suggest designing ads that include bottles or packs without labels to achieve earlier and faster attention capture. If the goal is to keep attention on the ad longer to convey information, we recommend using tags in Google ads. The transmission of this information in Google ads is a limitation. Since the content of the tags is difficult to interpret due to the size of the ads. In light of the results of this study, marketers may want to consider whether or not to use information-rich tags in search engine ads.
8. Theoretical Implications
Our work bridges the skills gap between industry professionals by providing a technique for analysing and interpreting data. This work can help marketers understand consumer behaviour and predict which advertisement may be most beneficial to the company from an attention point of view.
The current work demonstrates that, although the extrinsic characteristics of wine are important in capturing consumer attention, the inclusion in advertisements of containers without labels that allow the product to be fully displayed may not be an optimal strategy from the point of view of advertising attention. Similarly, ads that include packs of bottles in their design rather than individual bottles occupying a larger space within the ad may not achieve the desired effect on consumer attention.
Advances in the field of attention and the importance of attention for marketing now make it possible to understand the preattentive and attentive mode of the user. The first stage indicates where the first fixations are directed, and the second, where more special-ised processing takes place. These stages allow us to divide our hypotheses into two parts and to conclude which
9. Limitations and Future Lines of Research
Our work, like others, has several limitations inherent to this type of experimental research. First of all, we recognize that our research’s sample size differs from those employed in research using self-report techniques. At the same time, the interpretation of the results should be made with caution. We report a more natural, unconscious and pre-purchase behavioural capture of attention. It is the main advantage of applying the eye-tracking technique. Although the size of the experimental groups is small it is in line with the number of participants used in previous research [
5,
54]. It would be interesting to replicate this research using a larger sample size. It would improve the results obtained here and strengthen the use of attention in advertising effectiveness.
In the present study, the messages designed only studied the shape (individual bottle vs. pack) and the colour (opaque vs. transparent) of the bottle. However, there are other packaging characteristics, such as label design and other nonsensory characteristics, that can have a strong influence on attention to the message.
In our case, we did not collect information about the user’s online wine buying experience. This factor may influence the capture of consumer attention. The previous experience variable may act to moderate attention towards one type of ad or another. Future research could include an analysis of the moderating effect of this experience on the attention paid to the ad.
It seems that wine ads on Google make it difficult to perceive the label’s information; this limitation raises future research that includes more superficial elements other than the label in wine ads. These works could compare, for example, the attention capture and recall generated by the insertion of a brand logo inside the bottle or the type of wine (sparkling, fine…) in question.
Author Contributions
Conceptualization, S.C.-M.; data curation, D.G.-C.; formal analysis, D.G.-C., S.C.-M. and A.P.; funding acquisition, S.C.-M. and C.S.-D.; investigation, D.G.-C., A.Z.G. and C.S.-D.; methodology, D.G.-C. and Alberto Paramio; resources, S.C.-M.; software, C.S.-D.; visualization, P.P.M.-D.; writing—original draft, P.P.M.-D.; writing—review & editing, D.G.-C., A.P., A.Z.G. All authors have read and agreed to the published version of the manuscript.
Funding
The University of Cadiz funded this Research, grant number PR2017-039 of Plan Propio Project and was supported by the Institute of Research and Development Social and Sustainability (INDESS).
Institutional Review Board Statement
The study was conducted according to the guidelines of the Declaration of Helsinki, and approved by the Institutional Review Board (or Ethics Committee) of Cadiz University (protocol code 189 and date of approval). The Bioethics Committee of the University of Cadiz extends its competence to the field of research that uses data of a personal nature for the purposes foreseen in sub-section d), paragraph 1, of article 1, subject to reserved treatment due to affecting the rights and freedoms of individuals, the interests linked to the defence and protection of the environment or other constitutionally and legally protected assets.
Informed Consent Statement
Informed consent was obtained from all subjects in-volved in the study.
Data Availability Statement
The data are available upon request to the authors.
Acknowledgments
The authors want to show yours acknowledgement at the Institute of Research and Development Social and Sustainability (INDESS).
Conflicts of Interest
The authors declare no conflict of interest.
Appendix A
Table A1.
Randomization of experimental scenarios for single bottle of white wine.
Appendix B
Figure A1.
Selection of areas of interest.
Figure A1.
Selection of areas of interest.
References
- Russo, J.E.; Leclerc, F. An eye-fixation analysis of choice processes for consumer nondurables. J. Consum. Res. 1994, 21, 274–290. [Google Scholar] [CrossRef]
- Muñoz-Leiva, F.; Liébana-Cabanillas, F.; Hernández-Méndez, J. Etourism advertising effectiveness: Banner type and engagement as moderators. J. Serv. Mark. 2018, 32, 462–475. [Google Scholar] [CrossRef]
- Saura, J.R. Using data sciences in digital marketing: Framework, methods, and performance metrics. J. Innov. Knowl. 2020, 6, 92–102. [Google Scholar] [CrossRef]
- Gómez Carmona, D. Aplicación de la Neurociencia al Análisis de la Efectividad de la Comunicación de Energías Renovables; Universidad de Granada: Granada, Spain, 2020. [Google Scholar]
- Muñoz-Leiva, F.; Hernández-Méndez, J.; Gómez-Carmona, D. Measuring advertising effectiveness in Travel 2.0 websites through eye-tracking technology. Physiol. Behav. 2019, 200, 83–95. [Google Scholar] [CrossRef]
- Saura, J.R.; Bennett, D.R. A three-stage method for data text mining: Using UGC in business intelligence analysis. Symmetry 2019, 11, 519. [Google Scholar] [CrossRef] [Green Version]
- Laeng, B.; Suegami, T.; Aminihajibashi, S. Wine labels: An eye-tracking and pupillometry study. Int. J. Wine Bus. Res. 2016, 28, 327–348. [Google Scholar] [CrossRef]
- Fernandez, R. Global Market Share of Online Search Engines in 2020. Statista. 2021. Available online: https://es.statista.com/estadisticas/664510/desglose-porcentual-de-las-busquedas-online-mundiales-por-buscador/ (accessed on 12 May 2021).
- Broder, A. A Taxonomy of Web Search; ACM SIGIR Forum, Association for Computing Machinery (ACM): New York, NY, USA, 2002; Volume 36, pp. 3–10. [Google Scholar]
- Marcos, M.C.; González-Caro, C. Comportamiento de los usuarios en la página de resultados de los buscadores. Un estudio basado en eye tracking. Prof. Inf. 2010, 19, 348–358. [Google Scholar] [CrossRef] [Green Version]
- Wang, C.C.; Hung, J.C. Comparative analysis of advertising attention to Facebook social network: Evidence from eye-movement data. Comput. Hum. Behav. 2019, 100, 192–208. [Google Scholar] [CrossRef]
- Corduas, M.; Cinquanta, L.; Ievoli, C. The importance of wine attributes for purchase decisions: A study of Italian consumers’ perception. Food Qual. Prefer. 2013, 28, 407–418. [Google Scholar] [CrossRef]
- Lockshin, L.; Corsi, A.M. Consumer behaviour for wine 2.0: A review since 2003 and future directions. Wine Econ. Policy 2012, 1, 2–23. [Google Scholar] [CrossRef] [Green Version]
- Guerreiro, J.; Rita, P.; Trigueiros, D. Attention, emotions and cause-related marketing effectiveness. Eur. J. Mark. 2015, 49, 1728–1750. [Google Scholar] [CrossRef] [Green Version]
- Włodarska, K.; Pawlak-Leman’ska, K.; Górecki, T.; Sikorska, E. Factors influencing consumers’ perceptions of food: A study of apple juice using sensory and visual attention methods. Foods 2019, 8, 545. [Google Scholar] [CrossRef] [PubMed] [Green Version]
- Lockshin, L.; Jarvis, W.; d’Hauteville, F.; Perrouty, J.P. Using simulations from discrete choice experiments to measure consumer sensitivity to brand, region, price, and awards in wine choice. Food Qual. Prefer. 2006, 17, 166–178. [Google Scholar] [CrossRef]
- Hernández-Méndez, J.; Muñoz-Leiva, F.; Liébana-Cabanillas, F.J.; Marchitto, M. Análisis de la eficacia publicitaria y usabilidad en herramientas Travel 2.0. Un estudio experimental a través de la técnica de eye-tracking. Tour. Manag. Stud. 2016, 12, 7–17. [Google Scholar] [CrossRef] [Green Version]
- Orquin, J.L.; Loose, S.M. Attention and choice: A review on eye movements in decision making. Acta Psychol. 2013, 144, 190–206. [Google Scholar] [CrossRef] [Green Version]
- Glöckner, A.; Fiedler, S.; Hochman, G.; Ayal, S.; Hilbig, B.E. Processing differences between descriptions and experience: A comparative analysis using eye-tracking and physiological measures. Front. Psychol. 2012, 3, 173. [Google Scholar] [CrossRef] [Green Version]
- Su, Y.; Rao, L.L.; Li, X.; Wang, Y.; Li, S. From quality to quantity: The role of common features in consumer preference. J. Econ. Psychol. 2012, 33, 1043–1058. [Google Scholar] [CrossRef]
- Puyares, V.; Ares, G.; Carrau, F. Searching a specific bottle for Tannat wine using a check-all-that apply question and conjoint analysis. Food Qual. Prefer. 2010, 21, 684–691. [Google Scholar] [CrossRef]
- Jover, A.J.V.; Montes, F.J.L.; Fuentes, M.D.M.F. Measuring perceptions of quality in food products: The case of red wine. Food Qual. Prefer. 2004, 15, 453–469. [Google Scholar] [CrossRef]
- Saura, J.R.; Ribeiro-Soriano, D.; Palacios-Marqués, D. From user-generated data to data-driven innovation: A research agenda to understand user privacy in digital markets. Int. J. Inf. Manag. 2021, 102331, 1–13. [Google Scholar]
- Palacios-Marqués, D.; García, M.G.; Sánchez, M.M.; Mari, M.P.A. Social entrepreneurship and organizational performance: A study of the mediating role of distinctive competencies in marketing. J. Bus. Res. 2019, 101, 426–432. [Google Scholar] [CrossRef]
- Ghotbifar, F.; Marjani, M.; Ramazani, A. Identifying and assessing the factors affecting skill gap in digital marketing in communication industry companies. Indep. J. Manag. Prod. 2017, 8, 1–14. [Google Scholar] [CrossRef] [Green Version]
- Royle, J.; Laing, A. The digital marketing skills gap: Developing a Digital Marketer Model for the communication industries. Int. J. Inf. Manag. 2014, 34, 65–73. [Google Scholar] [CrossRef]
- Couldry, N.; Turow, J. Advertising, big data and the clearance of the public realm. Int. J. Commun. 2014, 8, 1710–1726. [Google Scholar]
- Homburg, C.; Klarmann, M.; Reimann, M.; Schilke, O. What drives key informant accuracy? J. Mark. Res. 2012, 49, 594–608. [Google Scholar] [CrossRef]
- Naidoo, V.; Hollebeek, L.D. Higher education brand alliances: Investigating consumers’ dual-degree purchase intentions. J. Bus. Res. 2016, 69, 3113–3121. [Google Scholar] [CrossRef]
- Saura, J.R.; Palos-Sánchez, P.; Cerdá Suárez, L.M. Understanding the digital marketing environment with KPIs and web analytics. Future Internet 2017, 9, 76. [Google Scholar] [CrossRef] [Green Version]
- Yeo, J.; Hwang, S.W.; Koh, E.; Lipka, N. Conversion prediction from clickstream: Modeling market prediction and customer predictability. IEEE Trans. Knowl. Data Eng. 2018, 32, 246–259. [Google Scholar] [CrossRef]
- Cacioppo, J.T.; Cacioppo, S.; Petty, R.E. The neuroscience of persuasion: A review with an emphasis on issues and opportunities. Soc. Neurosci. 2018, 13, 129–172. [Google Scholar] [CrossRef]
- Falk, E.; Scholz, C. Persuasion, influence, and value: Perspectives from communication and social neuroscience. Annu. Rev. Psychol. 2018, 69, 329–356. [Google Scholar] [CrossRef]
- Varadarajan, R.; Yadav, M.S. Marketing strategy in an internet-enabled environment: A retrospective on the first ten years of JIM and a prospective on the next ten years. J. Interact. Mark. 2009, 23, 11–22. [Google Scholar] [CrossRef]
- Giraldo-Romero, Y.I.; Muñoz-Leiva, F.; Higueras-Castillo, E.; Liébana-Cabanillas, F. Influence of regulatory fit theory on persuasion from google ads: An eye tracking study. J. Theor. Appl. Electron. Commer. Res. 2021, 16, 1165–1185. [Google Scholar] [CrossRef]
- Manchanda, P.; Dubé, J.P.; Goh, K.Y.; Chintagunta, P.K. The effect of banner advertising on internet purchasing. J. Mark. Res. 2006, 43, 98–108. [Google Scholar] [CrossRef]
- Hill, D. Tell me no lies: Using science to connect with consumers. J. Interact. Mark. 2003, 17, 61–72. [Google Scholar] [CrossRef]
- Kitchin, R. The Data Revolution: Big Data, Open Data, Data Infrastructures and Their Consequences; Sage: Thousand Oaks, CA, USA, 2014. [Google Scholar]
- Drèze, X.; Hussherr, F.X. Internet advertising: Is anybody watching? J. Interact. Mark. 2003, 17, 8–23. [Google Scholar] [CrossRef] [Green Version]
- Li, Q.; Huang, Z.J.; Christianson, K. Visual attention toward tourism photographs with text: An eye-tracking study. Tour. Manag. 2016, 54, 243–258. [Google Scholar] [CrossRef]
- Vila, J.; Gomez, Y. Extracting business information from graphs: An eye tracking experiment. J. Bus. Res. 2016, 69, 1741–1746. [Google Scholar] [CrossRef]
- Granka, L.A.; Joachims, T.; Gay, G. Eye-tracking analysis of user behavior in WWW search. In Proceedings of the 27th Annual International ACM SIGIR Conference on Research and Development in Information Retrieval, Sheffield, UK, 25–29 July 2004; pp. 478–479. [Google Scholar]
- Cutrell, E.; Guan, Z. What are you looking for? An eye-tracking study of information usage in web search. In Proceedings of the SIGCHI Conference on Human Factors in Computing Systems, Montréal, QC, Canada, 22–27 April 2007; pp. 407–416. [Google Scholar]
- Schultheiß, S.; Lewandowski, D. How users’ knowledge of advertisements influences their viewing and selection behavior in search engines. J. Assoc. Inf. Sci. Technol. 2020, 72, 285–301. [Google Scholar] [CrossRef]
- Liu, Z.; Liu, Y.; Zhou, K.; Zhang, M.; Ma, S. Influence of vertical result in web search examination. In Proceedings of the 38th International ACM SIGIR Conference on Research and Development in Information Retrieval, Santiago, Chile, 9–13 August 2015; pp. 193–202. [Google Scholar]
- Kammerer, Y.; Gerjets, P. The role of search result position and source trustworthiness in the selection of web search results when using a list or a grid interface. Int. J. Hum. Comput. Interact. 2014, 30, 177–191. [Google Scholar] [CrossRef]
- Schultheiß, S.; Sünkler, S.; Lewandowski, D. We still trust in Google, but less than 10 years ago: An eye-tracking study. Inf. Res. Int. Electron. J. 2018, 23, n3. [Google Scholar]
- Marvin, G. A Visual History of Google Ad Labeling in Search Results. Search Engine Land. Available online: https://scholar.google.es/scholar?lookup=0&q=Marvin,+G.+A+Visual+History+of+Google+Ad+Labeling+in+Search+Results.&hl=es&as_sdt=0,5 (accessed on 12 May 2021).
- Lewandowski, D. Is Google Responsible for Providing Fair and Unbiased Results. In The Responsibilities of Online Service Providers; Springer: Berlin/Heidelberg, Germany, 2017; pp. 61–77. [Google Scholar]
- Google Ads. Create a Shopping Campaign. 2021. Available online: https://support.google.com/google-ads/answer/3455481?hl=en (accessed on 25 January 2021).
- Lewandowski, D.; Kerkmann, F.; Rümmele, S.; Sünkler, S. An empirical investigation on search engine ad disclosure. J. Assoc. Inf. Sci. Technol. 2018, 69, 420–437. [Google Scholar] [CrossRef] [Green Version]
- Lewandowski, D.; Sünkler, S.; Kerkmann, F. Are Ads on Google Search Engine Results Pages Labeled Clearly Enough? Humboldt-Universität zu Berlin: Berlin, Germany, 2017. [Google Scholar]
- Buscher, G.; Dumais, S.T.; Cutrell, E. The good, the bad, and the random: An eye-tracking study of ad quality in web search. In Proceedings of the 33rd International ACM SIGIR Conference on Research and Development in Information Retrieval, Geneva Switzerland, 19–23 July 2010; pp. 42–49. [Google Scholar]
- González-Caro, C.; Marcos, M.C. Different users and intents: An eye-tracking analysis of web search. Proc. WSDM 2011, 11, 9–12. [Google Scholar]
- Djamasbi, S.; Hall-Phillips, A.; Yang, R.R. SERPs and ads on mobile devices: An eye tracking study for generation Y. In International Conference on Universal Access in Human-Computer Interaction; Springer: Berlin/Heidelberg, Germany, 2013; pp. 259–268. [Google Scholar]
- Hernández-Méndez, J.; Muñoz-Leiva, F. What type of online advertising is most effective for eTourism 2.0? An eye tracking study based on the characteristics of tourists. Comput. Hum. Behav. 2015, 50, 618–625. [Google Scholar] [CrossRef]
- Danaher, P.J.; Mullarkey, G.W. Factors affecting online advertising recall: A study of students. J. Advert. Res. 2003, 43, 252–267. [Google Scholar] [CrossRef]
- Lagun, D.; Mcmahon, D.; Navalpakkam, V. Understanding mobile searcher attention with rich ad formats. In Proceedings of the 25th ACM International on Conference on Information and Knowledge Management, Indianapolis, IN, USA, 24–28 October 2016; pp. 599–608. [Google Scholar]
- Lewandowski, D.; Kammerer, Y. Factors influencing viewing behaviour on search engine results pages: A review of eye-tracking research. Behav. Inf. Technol. 2020, 40, 1–31. [Google Scholar] [CrossRef]
- Folkes, V.; Matta, S. The effect of package shape on consumers’ judgments of product volume: Attention as a mental contaminant. J. Consum. Res. 2004, 31, 390–401. [Google Scholar] [CrossRef]
- Rocchi, B.; Stefani, G. Consumers’ perception of wine packaging: A case study. Int. J. Wine Mark. 2006, 18, 33–44. [Google Scholar] [CrossRef]
- Monteiro, P.; Guerreiro, J.; Loureiro, S.M.C. Understanding the role of visual attention on wines’ purchase intention: An eye-tracking study. Int. J. Wine Bus. Res. 2019, 32, 161–179. [Google Scholar] [CrossRef]
- Han, J.W.; Ruiz-Garcia, L.; Qian, J.P.; Yang, X.T. Food packaging: A comprehensive review and future trends. Compr. Rev. Food Sci. Food Saf. 2018, 17, 860–877. [Google Scholar] [CrossRef] [Green Version]
- Chandran, S.; Batra, R.K.; Lawrence, B. Is seeing believing? Consumer responses to opacity of product packaging. ACR N. Am. Adv. 2009, 36, 970. [Google Scholar]
- Deng, X.; Srinivasan, R. When do transparent packages increase (or decrease) food consumption? J. Mark. 2013, 77, 104–117. [Google Scholar] [CrossRef] [Green Version]
- Wansink, B.; Painter, J.E.; Lee, Y.K. The office candy dish: Proximity’s influence on estimated and actual consumption. Int. J. Obes. 2006, 30, 871–875. [Google Scholar] [CrossRef] [PubMed] [Green Version]
- Vilnai-Yavetz, I.; Koren, R. Cutting through the clutter: Purchase intentions as a function of packaging instrumentality, aesthetics, and symbolism. Int. Rev. Retail Distrib. Consum. Res. 2013, 23, 394–417. [Google Scholar] [CrossRef]
- Simmonds, G.; Woods, A.T.; Spence, C. ‘Show me the goods’: Assessing the effectiveness of transparent packaging vs. product imagery on product evaluation. Food Qual. Prefer. 2018, 63, 18–27. [Google Scholar] [CrossRef]
- Simmonds, G.; Spence, C. Thinking inside the box: How seeing products on, or through, the packaging influences consumer perceptions and purchase behaviour. Food Qual. Prefer. 2017, 62, 340–351. [Google Scholar] [CrossRef]
- Orquin, J.L.; Bagger, M.P.; Lahm, E.S.; Grunert, K.G.; Scholderer, J. The visual ecology of product packaging and its effects on consumer attention. J. Bus. Res. 2020, 111, 187–195. [Google Scholar] [CrossRef]
- Piqueras-Fiszman, B.; Velasco, C.; Salgado-Montejo, A.; Spence, C. Using combined eye tracking and word association in order to assess novel packaging solutions: A case study involving jam jars. Food Qual. Prefer. 2013, 28, 328–338. [Google Scholar] [CrossRef]
- Stremersch, S.; Tellis, G.J. Strategic bundling of products and prices: A new synthesis for marketing. J. Mark. 2002, 66, 55–72. [Google Scholar] [CrossRef] [Green Version]
- Engeset, M.G.; Opstad, B. Evaluation effects of bundle size and price presentation. J. Consum. Mark. 2017, 34, 393–403. [Google Scholar] [CrossRef] [Green Version]
- Sample, K.L.; Hagtvedt, H.; Brasel, S.A. Components of visual perception in marketing contexts: A conceptual framework and review. J. Acad. Mark. Sci. 2020, 48, 405–421. [Google Scholar] [CrossRef]
- Landwehr, J.R.; McGill, A.L.; Herrmann, A. It’s got the look: The effect of friendly and aggressive “facial” expressions on product liking and sales. J. Mark. 2011, 75, 132–146. [Google Scholar] [CrossRef]
- Raghubir, P.; Krishna, A. Vital dimensions in volume perception: Can the eye fool the stomach? J. Mark. Res. 1999, 36, 313–326. [Google Scholar] [CrossRef] [Green Version]
- Baylis, G.C.; Driver, J. Visual attention and objects: Evidence for hierarchical coding of location. J. Exp. Psychol. Hum. Percept. Perform. 1993, 19, 451–470. [Google Scholar] [CrossRef] [PubMed]
- Bloch, P.H. Seeking the ideal form: Product design and consumer response. J. Mark. 1995, 59, 16–29. [Google Scholar] [CrossRef] [Green Version]
- Groenhaug, K.; Kvitastein, O.; Grønmo, S. Factors moderating advertising effectiveness as reflected in 333 tested advertisements. J. Advert. Res. 1991, 31, 42–50. [Google Scholar]
- Mussweiler, T. Comparison processes in social judgment: Mechanisms and consequences. Psychol. Rev. 2003, 110, 472–489. [Google Scholar] [CrossRef] [PubMed] [Green Version]
- Wedel, M.; Pieters, R. Eye fixations on advertisements and memory for brands: A model and findings. Mark. Sci. 2000, 19, 297–312. [Google Scholar] [CrossRef] [Green Version]
- Hair, J.F.; Anderson, R.E.; Tatham, R.L.; Black, W.C. Análisis Multivariante (Volume 491); Prentice Hall: Madrid, Spain, 1999. [Google Scholar]
- Zikmund, W.G.; Manzano, J.A.; Reyes, M.L. Fundamentos de Investigación de Mercados; THOMSON: Stamford, CT, USA, 2003. [Google Scholar]
- Goldberg, J.H.; Wichansky, A.M. Eye tracking in usability evaluation: A practitioner’s guide. In The Mind’s Eye; Elsevier: Amsterdam, The Netherlands, 2003; pp. 493–516. [Google Scholar]
- Sheehan, K.B. Toward a typology of Internet users and online privacy concerns. Inf. Soc. 2002, 18, 21–32. [Google Scholar] [CrossRef]
- Pieters, R.; Wedel, M. Attention capture and transfer in advertising: Brand, pictorial, and text-size effects. J. Mark. 2004, 68, 36–50. [Google Scholar] [CrossRef]
- Holmqvist, K.; Nyström, M.; Andersson, R.; Dewhurst, R.; Jarodzka, H.; Weijer, J.V.D. Eye Tracking: A Comprehensive Guide to Methods and Measures; OUP: Oxford, UK, 2011. [Google Scholar]
- Bodeboca. 2017. Available online: https://www.bodeboca.com (accessed on 2 October 2020).
| Publisher’s Note: MDPI stays neutral with regard to jurisdictional claims in published maps and institutional affiliations. |
© 2021 by the authors. Licensee MDPI, Basel, Switzerland. This article is an open access article distributed under the terms and conditions of the Creative Commons Attribution (CC BY) license (https://creativecommons.org/licenses/by/4.0/).


 ,
, 


