


The deterioration of built heritage is a major concern for many countries. In the specific case of brick heritage buildings, degradation depends on several factors such as the chemical and mineralogical composition and the porosity of the bricks, floor insulation and exposure to environmental conditions. This paper applies a probabilistic Bayesian approach to identifying the pattern of recession of the brick walls using digital photogrammetry data. Two cases studies are presented corresponding to two buildings classified as Assets of Cultural Interest by the Spanish Ministry of Culture. The analysis of physico-chemical factors and photogrammetric descriptions allow a holistic understanding of the deterioration process to be developed. The degradation patterns and degradation velocities obtained are used for the structural assessment of the buildings. The comparison of the degradation patterns of both buildings considering their individual features allows the most critical factors in the degradation process of brick walls to be identified.
El deterioro del patrimonio construido es una gran preocupación para muchos países. En el caso específico de los edificios patrimoniales de ladrillo, la degradación depende de varios factores como la composición química y mineralógica y la porosidad de los ladrillos, el aislamiento del suelo y la exposición a las condiciones ambientales. Este artículo aplica un enfoque probabilístico bayesiano para identificar el patrón de recesión de las paredes de ladrillo utilizando datos de fotogrametría digital. Se presentan dos casos de estudio correspondientes a dos edificios catalogados como Bienes de Interés Cultural por el Ministerio de Cultura español. El análisis de los factores físico-químicos y las descripciones fotogramétricas permiten desarrollar una comprensión holística del proceso de deterioro. Los patrones de degradación y las velocidades de degradación obtenidos se utilizan para la evaluación estructural de los edificios. La comparación de los patrones de degradación de ambos edificios considerando sus características individuales permite identificar los factores más críticos en el proceso de degradación de las paredes de ladrillo.
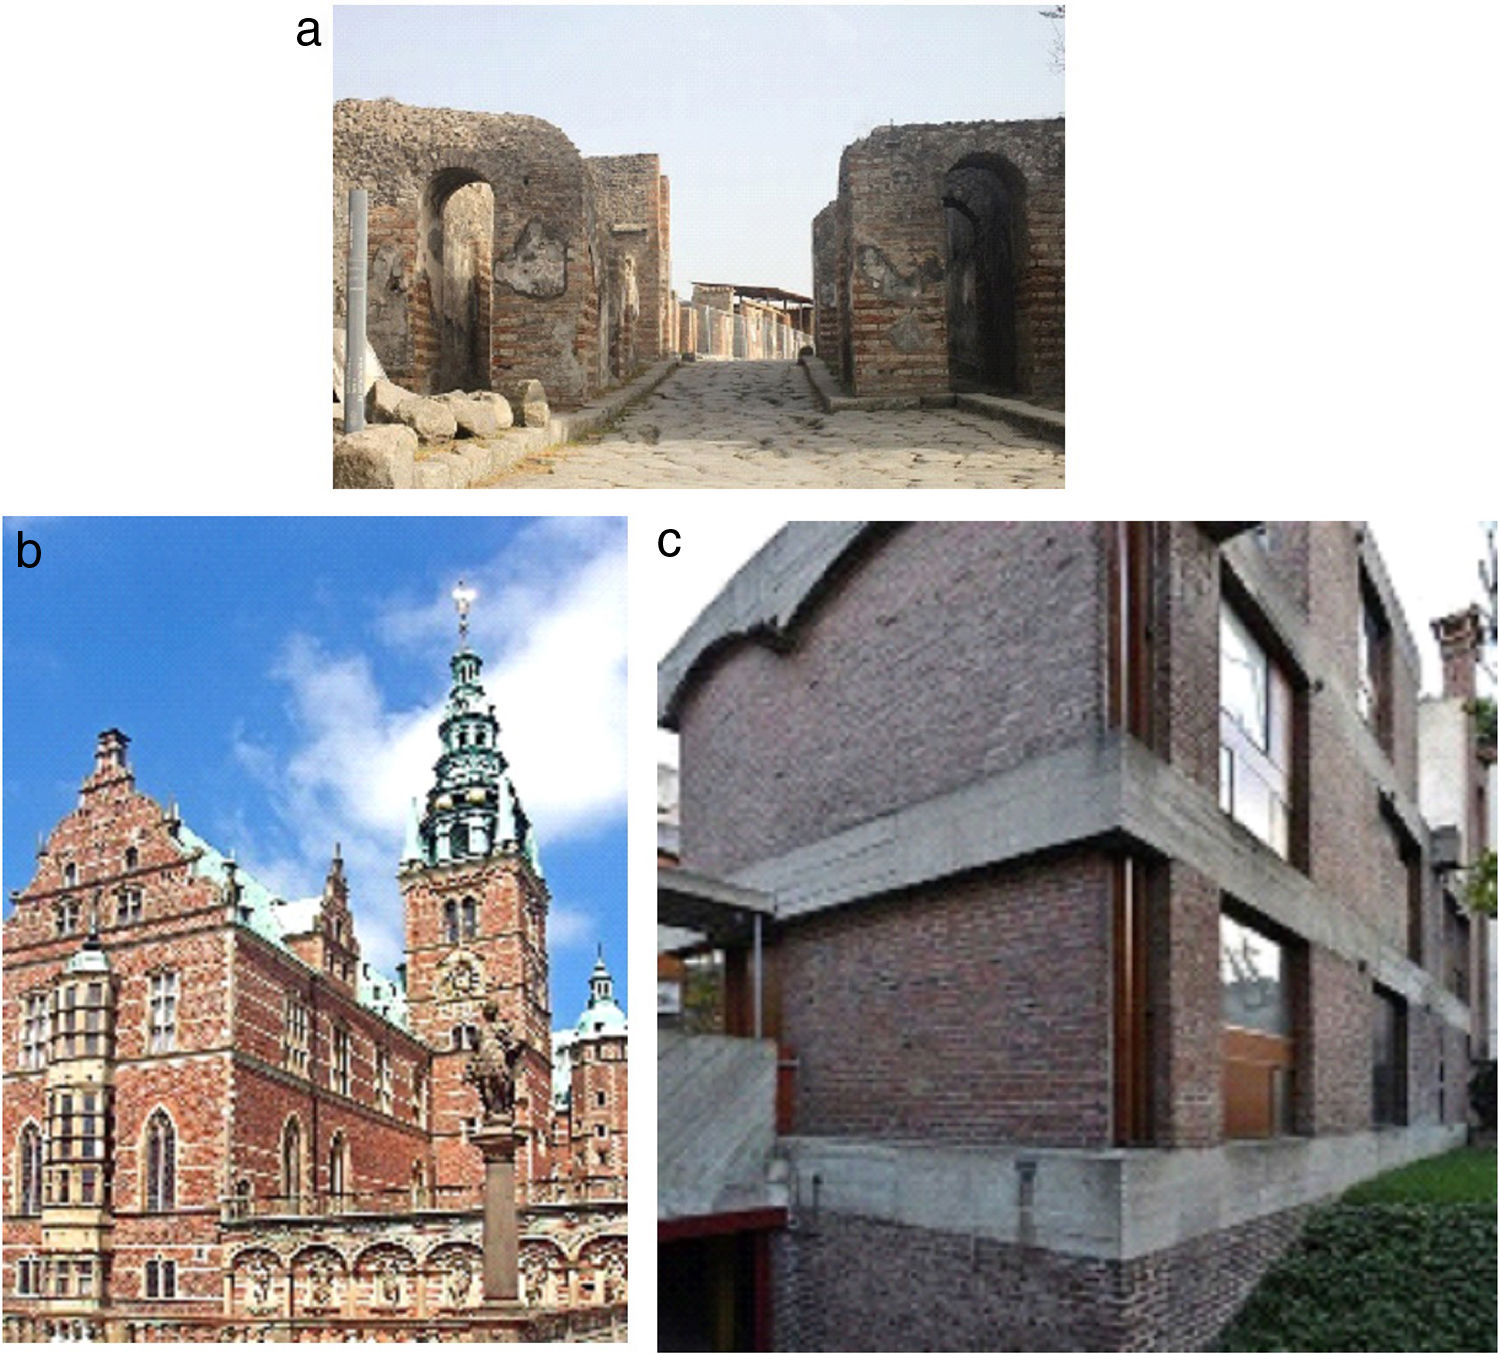
Brick has been used for building purposes for thousands of years. The oldest bricks were made with mud dried in the sun to harden it, but it was the invention of fired brick around 3500 BC which allowed the use of bricks even in cool areas. The Romans spread the use of construction with fired bricks by constructing public and private buildings all over the entire empire (see the Herculaneum gate in Pompeii in Fig. 1a). Between the 12th and 16th centuries, in the Baltic countries spectacular buildings were built mainly with fired red clay bricks (during the Brick Romanesque, Brick Gothic, and Brick Renaissance periods, see in Fig. 1b).
 The Herculaneum gate of Pompeii. (b) Frederiksborg Palace in Denmark, built during the first years of the 17th century. (c) Maisons Jaoul of Le Corbusier in France.")
During the Renaissance and Baroque periods, brick masonry façades were not common, and it was not until the mid-18th century that brick walls started appearing, a resurgence that was mainly due to the fact that the industrial revolution allowed for bricks to be produced on a massive scale, which meant they stopped being made by hand.
In the 20th century, exposed brick walls started to be used again because of their durability, the fact that they needed less costly maintenance, and the influence of famous architects, such as Le Corbusier, who used them in their works (see Fig. 1c).
Currently, some of these brick masonry buildings have been classified as Cultural Heritage (CH) assets and they have been the subject of major interest. However the degradation of our cultural brick heritage is happening faster today than at any time in the past [1]. Accordingly, the structural assessment of these kind of heritage constructions is essential. Recent works have applied the non-destructive testing (NDT [2–5]) and monitoring techniques available for the characterization of brick masonry elements [6–8].
In this paper, the degree of deterioration of CH brick masonry elements are studied, considering both physicochemical material deterioration and high-scale structural-level degradation, which is directly related to the actual structural integrity of a building. As in [9], a probabilistic approach has been adopted for the surface recession assessment based on a simple non-destructive technique: digital photogrammetry. The method proposed is based on solid Bayesian system identification principles [10], allowing for the identification of the surface corresponding to the recession pattern for a given photogrammetric dataset.
A suitable quantification of the level of degradation and its magnitude requires taking into account several factors that cause deterioration or erosion in bricks. This degradation impairs the aesthetics of façades and poses threats not only at a cultural level but also in terms of safety and cost. In this paper, how exposure to degrading agents impacts brick walls service life is analyzed. The measurement of the degree of deterioration of CH brick buildings is a useful tool for supporting decision making about preventive maintenance [11], restoration [12], and resilience to climate change [13].
Cycles of moisture exposure (i.e. first contact with water, wetting, and drying) [14] and freezing while wet are the major causes of damage to brick buildings [15]. The effect of salt contamination accumulated over time on CH brick buildings is another cause of damage. The damage associated with salt implies the presence of moisture that enables dissolution-crystallization cycles and the transportation of the salts [16,17]. In this work, several degradation factors are considered: the level of exposure to the direct action of water [18] and/or wind [19], the level of insulation of the bricks from the ground, the chemical and mineralogical composition of the bricks and the influence of hazard events such as freeze–thaw cycles [20], moisture exposure [14], and environmental pollution.
MethodologyCharacterization of the materialIn this study, representative samples of bricks from two CH buildings have been used to characterize the material. Chemical, mineralogical, and physical characterizations have been conducted.
Regarding the mineralogical composition of the bricks, in order to characterize the crystalline phases present in the bricks, both the majority and minority crystalline compounds were determined by X-ray diffraction (XRD). Samples are ground and sieved until a grain size smaller than 80μm was obtained. The powder samples were analyzed using a D8 ADVANCE Theta-Theta Equipment diffractometer whose X-ray tube is a 2.2kW copper anode.
The chemical composition was determined from an elemental chemical analysis of the brick samples performed using the X-ray fluorescence (XRF) technique in melted samples with a wavelength dispersion X-ray spectrometer, Bruker's S8 Tiger. The percentage of CO2 was determined by loss to fire in accordance with the ASTM C114-18 standard [21]. The alkalis were determined by using the inductively coupled plasma technique (ICP) with Varian 725-ES equipment. Chlorides were analyzed with a Titrino 702 SM potentiometric validator, with a chloride selective electrode. Nitrites, nitrates, and phosphates were determined by using Ionic Chromatography with Metrohm 930 Compact IC Flex equipment.
A chemical analysis of soluble extracted salts was carried out in order to assess the possible contribution of easily extractable salts to brick deterioration. In order to evaluate both the potential extraction of salts and the alkalis, a 7-day leaching test at room temperature was conducted based on the test procedure for alkali extraction in concrete [22]. Once the established period had ended, the samples were filtered with a 25mm millipore filter by using ionic chromatography (IC) to obtain the nitrites and nitrates. The extracted salts were analyzed and the total alkali content (Na2O and K2O) was determined by using the inductively coupled plasma technique (ICP). Sulphates and chlorides were determined using gravimetry and potentiometry methods, respectively.
The open porosity of the bricks was also determined. Both the porosity accessible to water and the apparent density of the representative samples of the bricks were determined in accordance with the test method of the UNE EN 83980: 2014 standard [23]. The water absorption, density and porosity accessible to water were determined by the method of water absorption by using vacuum and hydrostatic weighing of the samples. Once the brick samples had been saturated through water immersion, the specimens were dried until they reached a constant weight at low humidity.
Characterization of the climate conditionsHistorical weather data in Granada and Madrid are shown in Tables A1 and A2, respectively (see Appendix). The climatological data from the last 40 years summarized in Tables A1 and A2 have been obtained from official Spanish meteorological sites [24,25]. The climatological parameters are average and absolute maximum and minimum temperatures in degrees centigrade, absolute maximum gust in km/h, and average pluviosity in mm.
Identification of surface recessionThe surface recession defines the loss of volume of the façade walls of a building due to the action of degradation factors (chemical, climatic, …).
A Bayesian inference framework has been adopted to identify a surface recession geometrical pattern using digital photogrammetry data. The methodology for both the photogrammetry survey and the Bayesian inference was previously published in [9], in which it was applied to degraded stone facades, but here it has been applied to brick walls containing different deterioration areas in the same section.
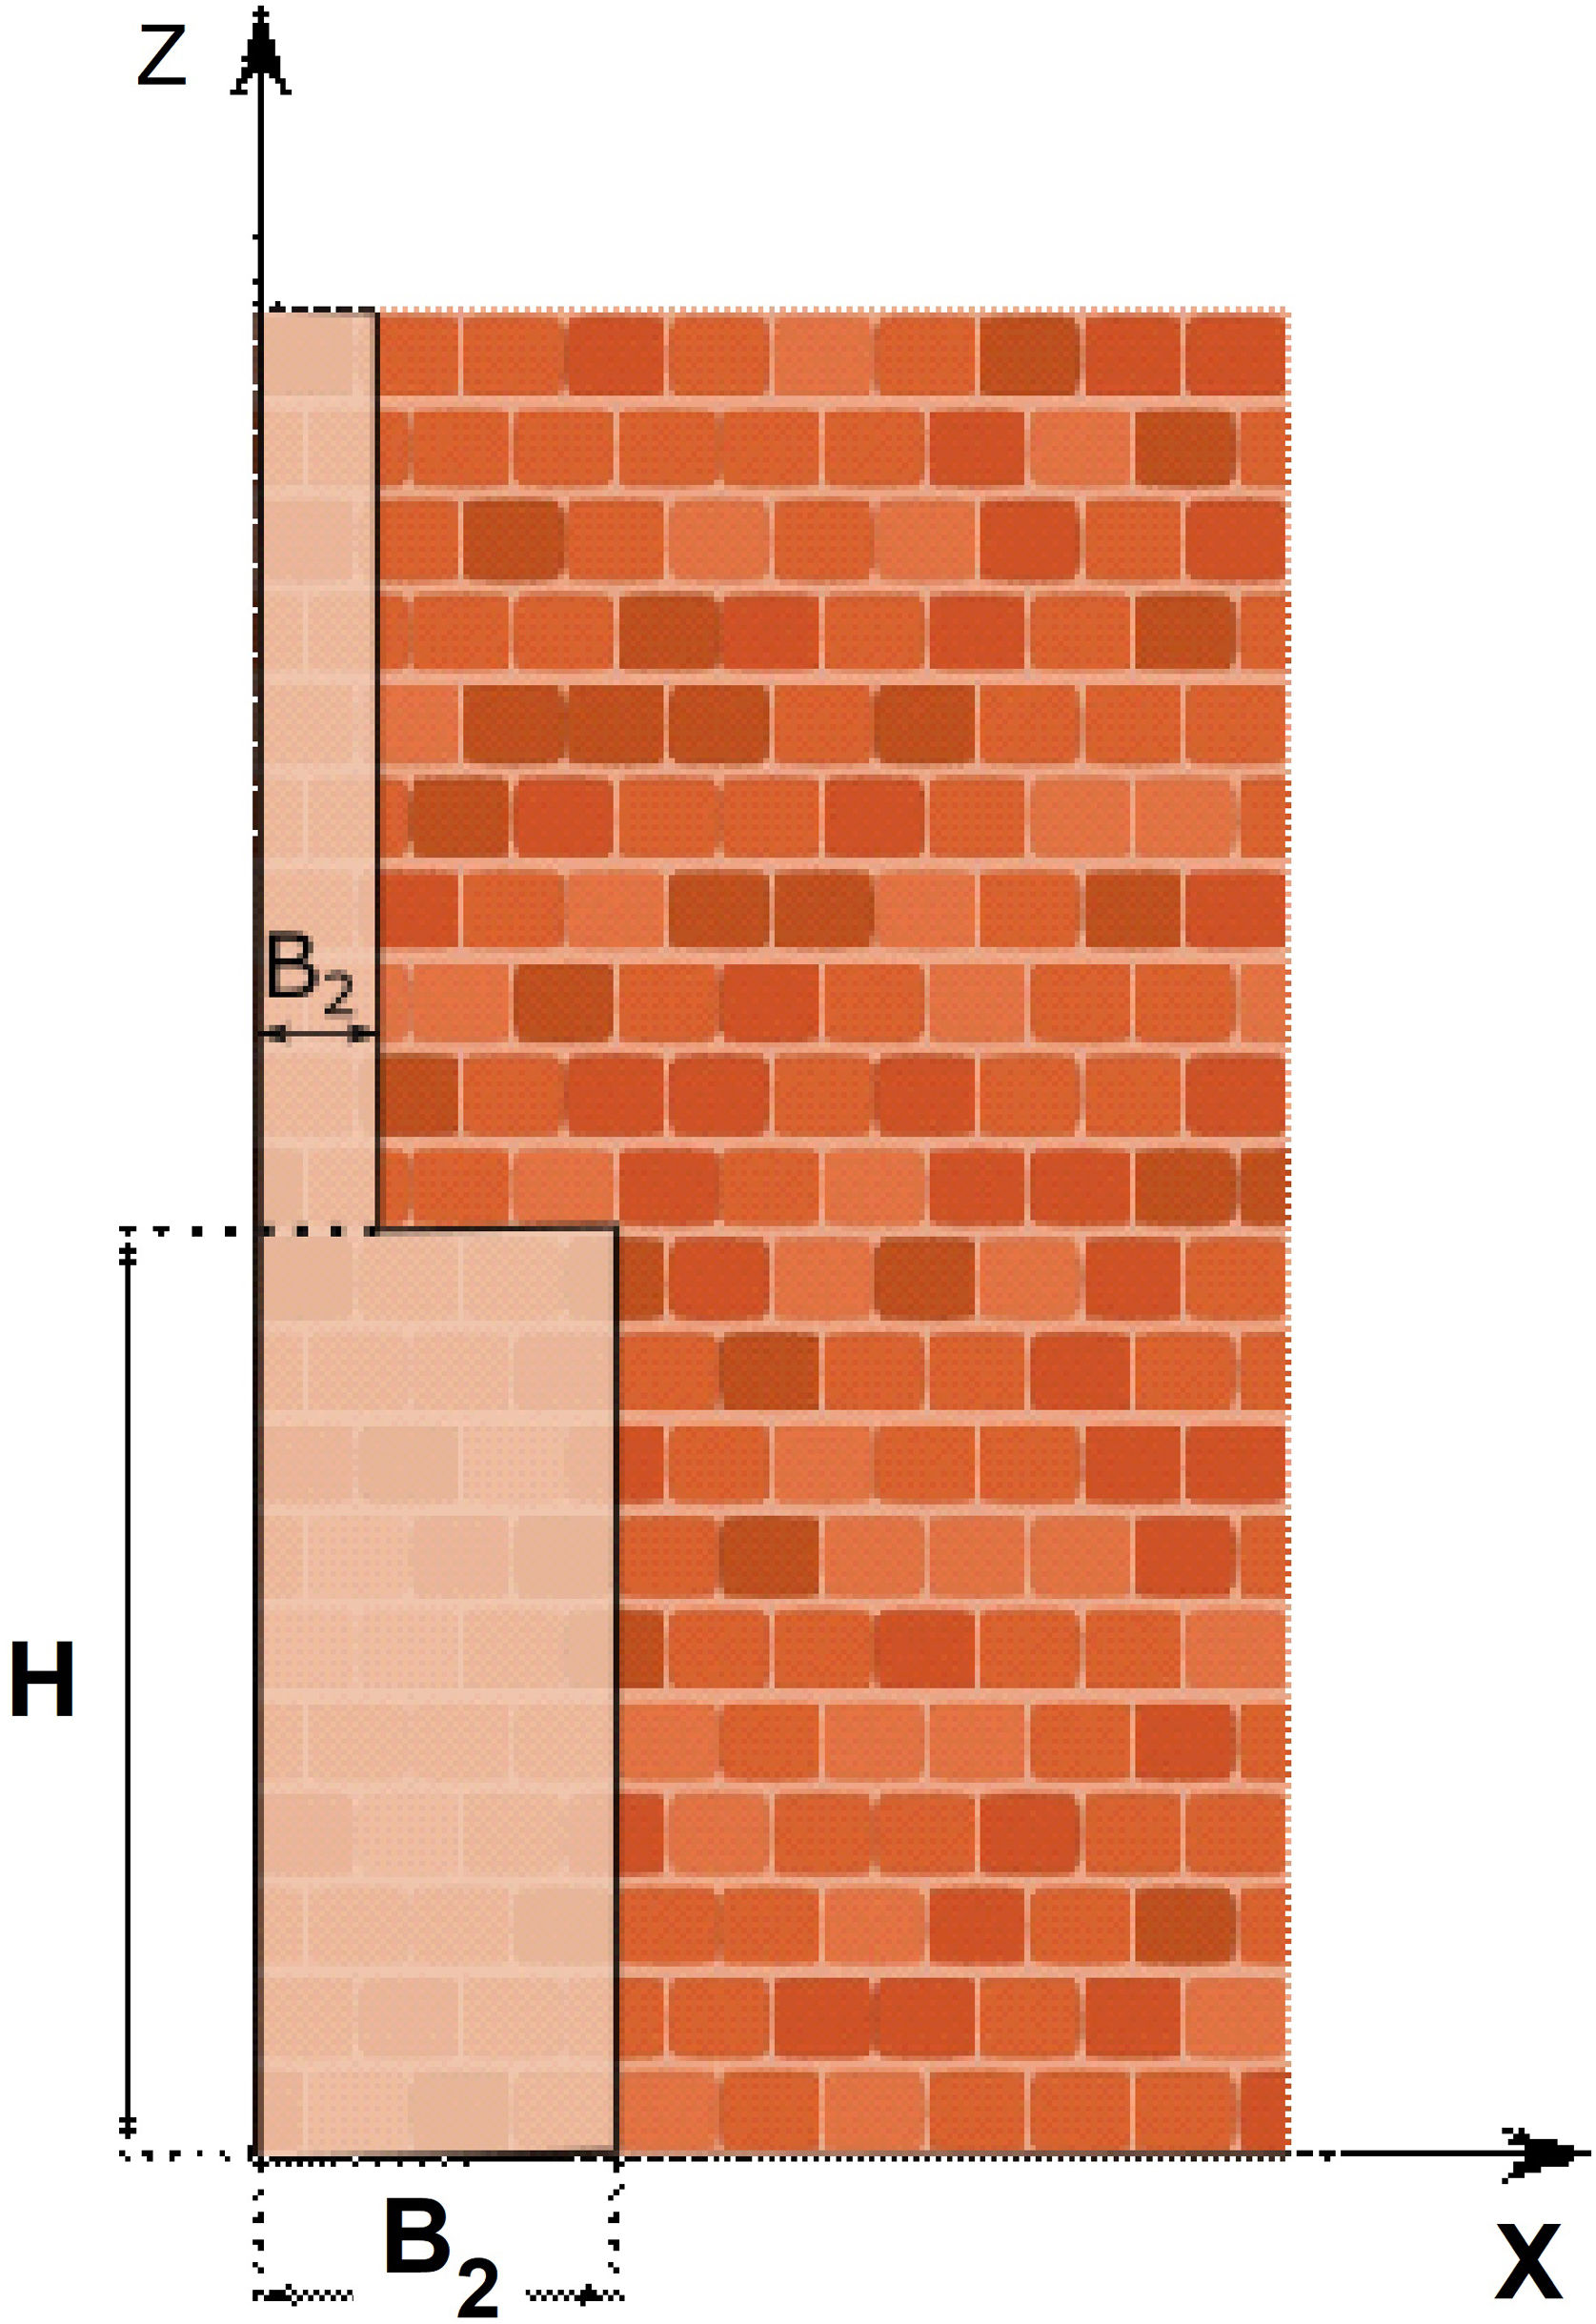
Among all the possible candidate regression profiles (parabolic, triangular, bilinear, rectangular, …) [9], it has been proved that the one that best fit to the two cases studied of brick wall is the rectangular one. So, the parameterized degradation pattern depicted in Fig. 2 has been assumed. In Fig. 2, two different deteriorated areas can be seen being B1 and B2 the wall's thickness losses and H the height of the wall most affected by degradation, respectively. However, the methodology can be applied to n steps of degradation by using Bayesian inference. The plausible values of the degradation parameters θ={B, H} defining the geometry of the degraded area were obtained in the form of Probability Density Function (PDF) p(θ|zD), where zD represents the data from photogrammetry. In this research, only one candidate degradation pattern (Fig. 2) has been considered in order to compare the basic parameters of the degradation θ={B, H} obtained in the buildings studied, that is: the height and the depth of the degradation.

This candidate degradation pattern is described in a probabilistic way by introducing two error terms e1, e2 which measure the discrepancy between the degradation pattern zM(θ) and the data in the two different degradation areas of the wall zD:
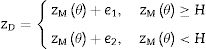
Using the Principle of Maximum Information Entropy [26], a zero mean Gaussian distribution was conservatively assumed to model error variables e1, e2. Thus, the degradation profile of the wall zD was represented using the following probability density function:
where F(θ) is a goodness-of-fit function which is defined as the l2-norm of the measured and modeled data as: Fθ=∑j=1Nszj,M−1θ−zj,D−1θ1/2, with zj,M−1θ and zj,D−1θ being the abscissa image of the jth element of the vectors zM and zD, respectively, and σei is the standard deviation of the jth component of the model error, with j=1,…, Ns.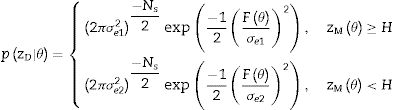
Following the Bayesian approach, the posterior distribution of the model parameters pθ|zD can be obtained using Bayes’ Theorem, as follows:
where pzD|θ is the likelihood function represented by Eq. (1), pθ is the prior distribution of the uncertain parameters, and pzD is the evidence of the model in representing the data zD.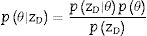
To solve Eq. (3), the Metropolis–Hastings algorithm [27,28] has been adopted for its simplicity and efficiency.
ResultsReal case studiesThe influence of several factors, such as the chemical and mineralogical composition, the porosity of the bricks, moisture, freeze–thaw cycles, salts and leached alkalis, ground isolation, and pollution in the degradation patterns is illustrated here for cultural heritage brick buildings. In particular, two different Spanish CH buildings Puerta Elvira (Granada) and the Residencia de Estudiantes (Madrid) were investigated.
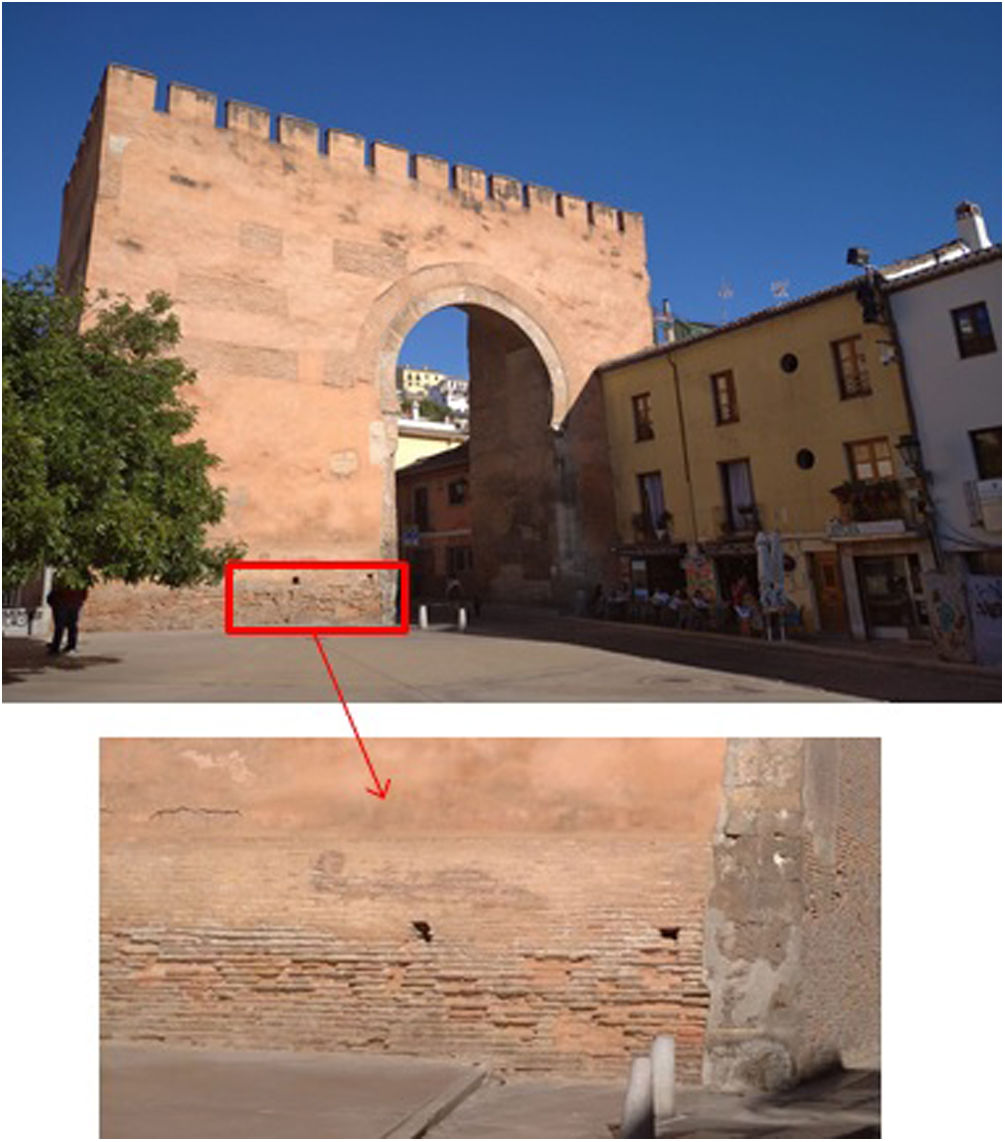
Puerta Elvira (Bab Ilvira, see Fig. 3), is a fortress gate constructed with several materials (bricks, rammed earth and stone). Puerta Elvira was built in the 11th century and has undergone several transformations throughout its history. In 1612, the esplanade in front of the gate was leveled, and houses that were attached to the wall were built, which have remained almost unchanged. Currently Puerta Elvira is formed by the exterior arch (from the 14th century), two rammed earth towers that flanked the arch, and by three brick niches [29]. Throughout the 20th century it underwent depth restoration and consolidation works. Numerous repairs are visible on the main facade. The most important intervention was the inlay of handmade brick pieces of different thicknesses to fill gaps produced by the loss of the original rammed earth in 1957 [29,30].
. Detail of the bricks.")
Puerta Elvira was classified as a “National Historical and Artistic Monument” in 1896, considered valuable to society, and therefore worthy of preservation to future generations.
Regarding the soil, Puerta Elvira is located over the alluvial fans called Alhambra conglomerate, mostly constituted of rounded stones with an average size of 10cm that generally has a silty-sandy matrix, that is sometimes clayey [31].
In this research, the brick strip located on the left side of the main facade of PE is analyzed in detail.
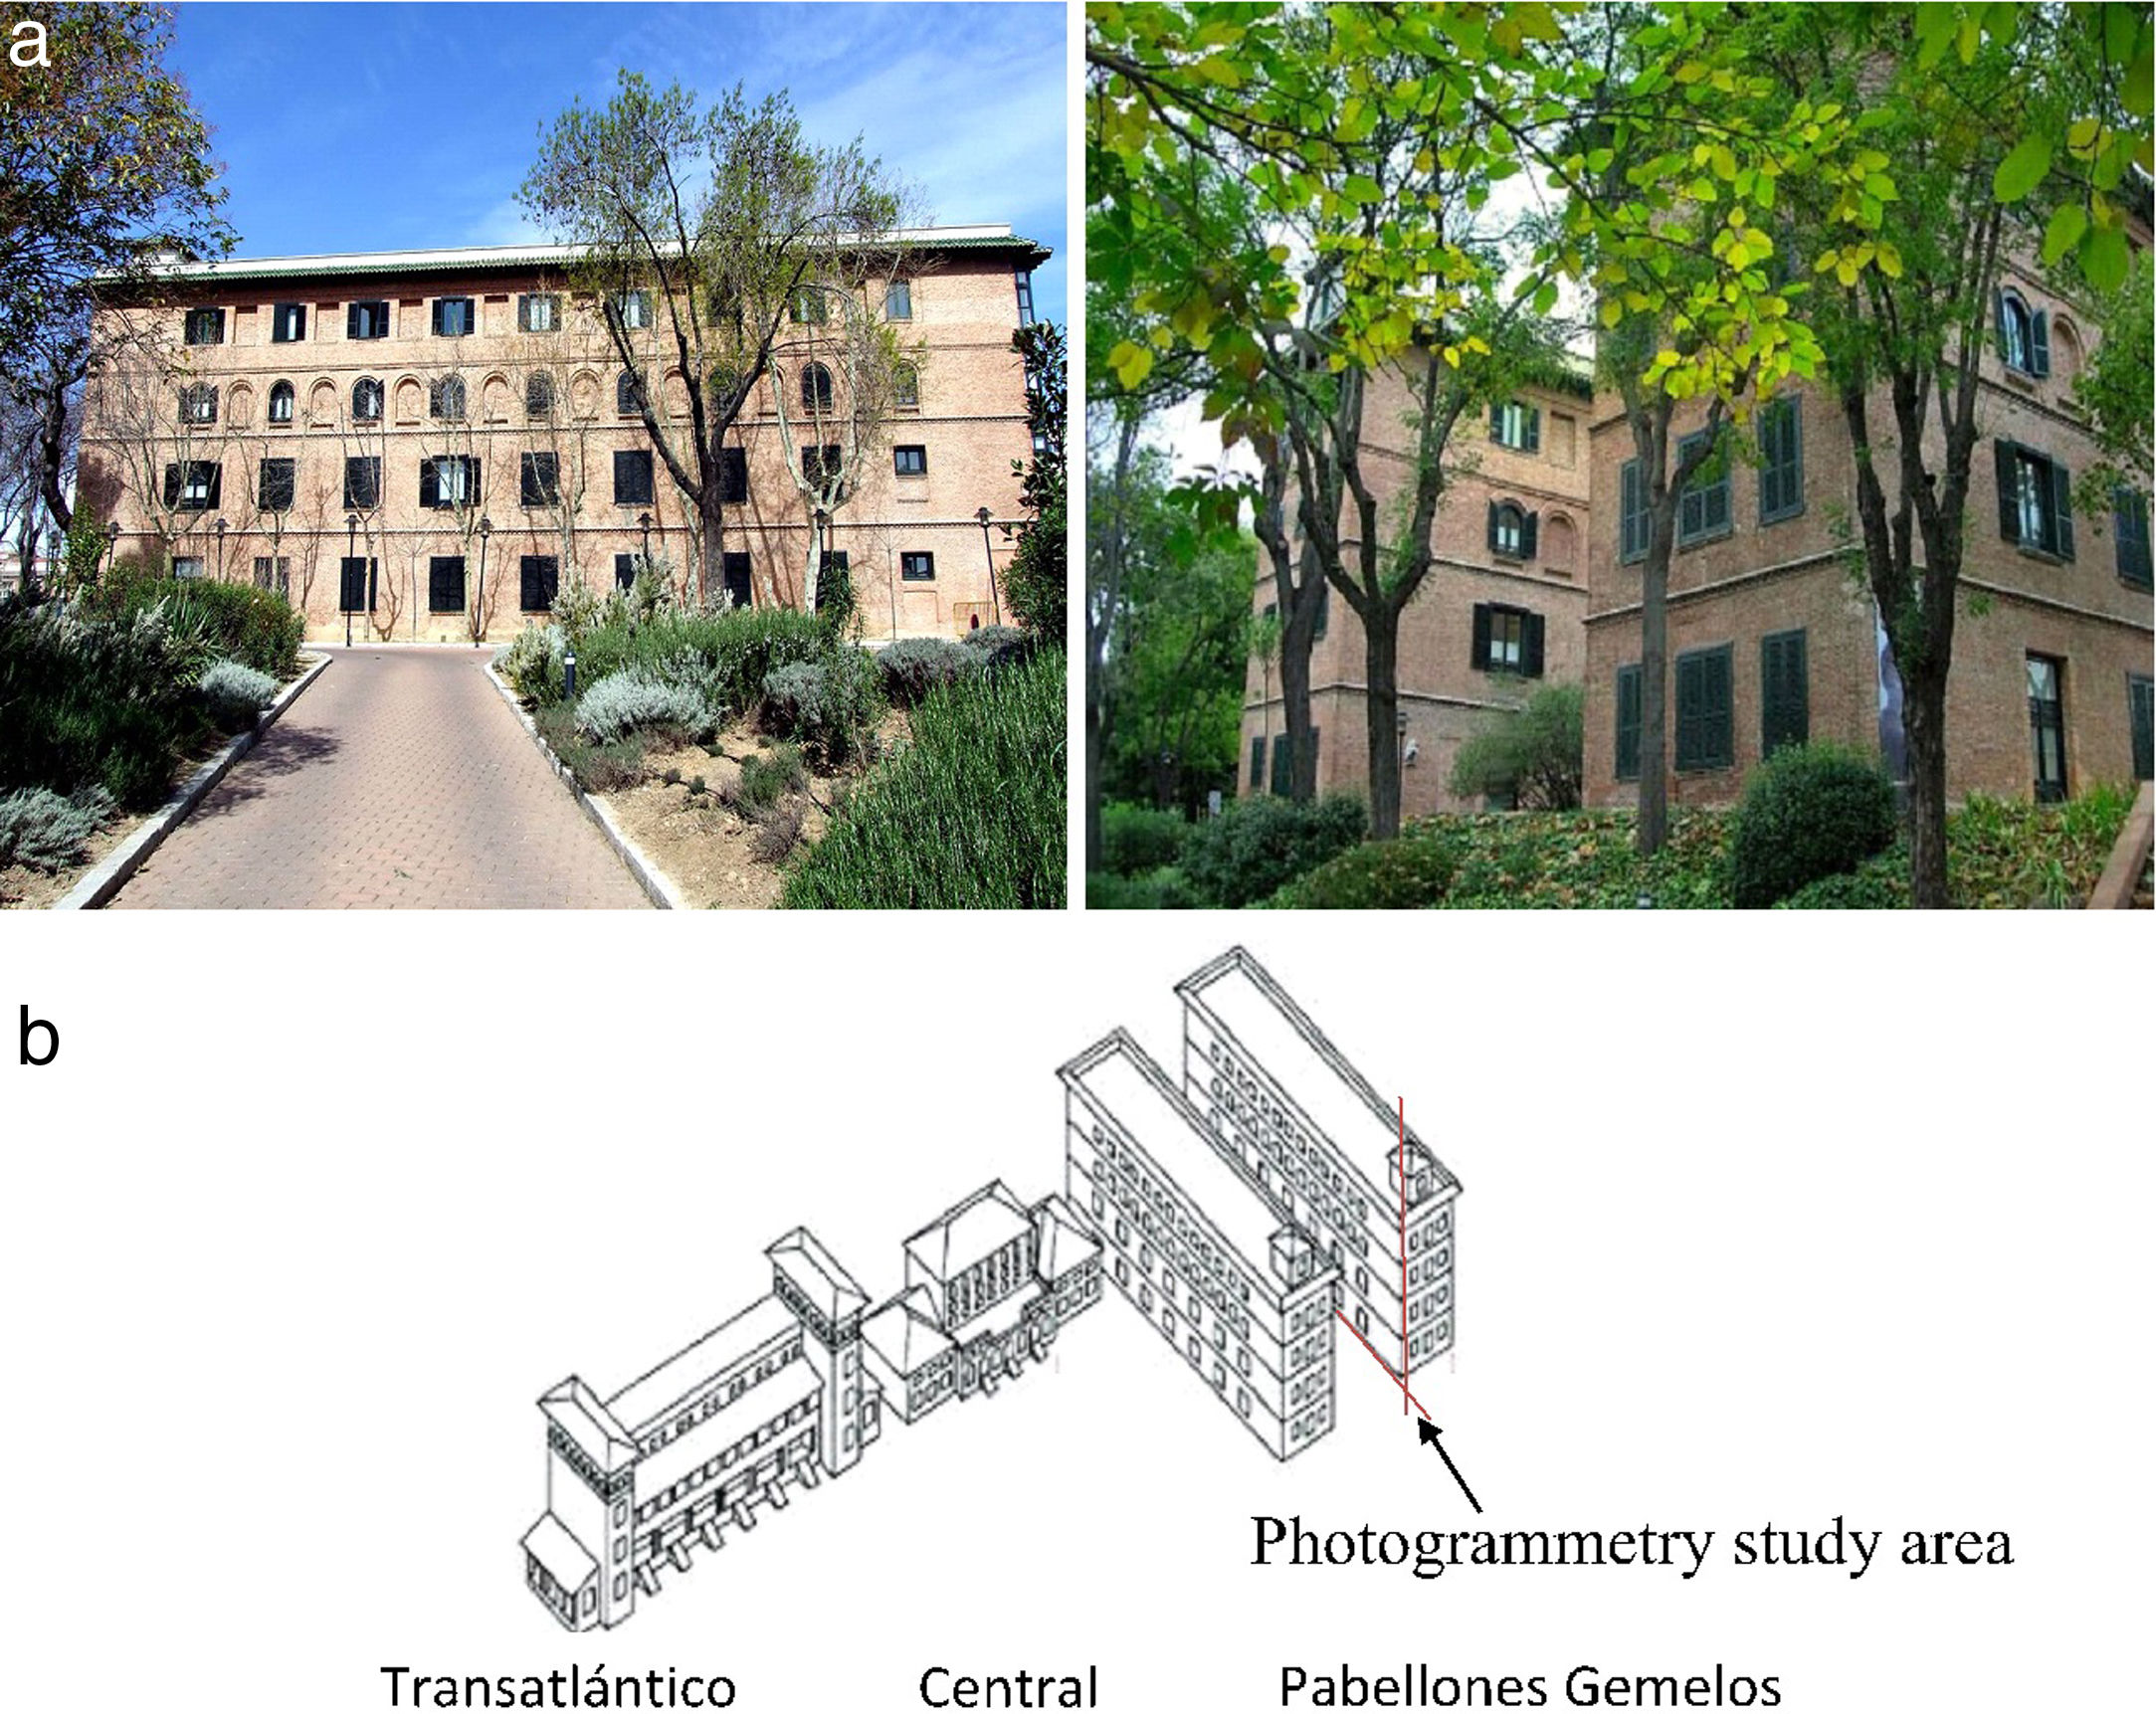
The Residencia de Estudiantes is an architectural complex made up of four buildings located in the center of Madrid. In 1913, the Pabellones Gemelos were constructed, two linear blocks with an east–west orientation. In 1915, two new buildings were added: the Transatlántico and the Pabellón Central (see Fig. 4). The four buildings are brick facade. In the 1940s an additional floor was added to the Pabellones Gemelos. The complex suffered major deteriorations because of years of neglect until being rehabilitated in the period 1991–2001 (in 1991 Transatlántico, in 1994 Central and in 1998 the Pabellones Gemelos). In 1978, the architectural complex was declared as an Asset of Cultural Interest (BIC), a legal frameword for the protection of Spanish historical heritage, from the Spanish Ministry of Culture. In 1997, both the gardens and pavilions were included in the Protected Buildings Catalog of Madrid, and in 2006, the Residencia de Estudiantes received the title of Spanish European Heritage Site from the European Heritage Committee.
![Residencia de Estudiantes, Madrid (Spain). (a) Views of the Pabellones Gemelos, (b) General scheme adapted from [32].](https://static.elsevier.es/multimedia/03663175/0000006100000004/v1_202207290548/S0366317522000267/v1_202207290548/en/main.assets/gr4.jpeg?xkr=ue/ImdikoIMrsJoerZ+w997EogCnBdOOD93cPFbanNd3TCEZuNxhudow/+3Hrh9WJc+mtnYSSPL9K6mfMWVj1pa+qAoxGkmeGl+A1vof92qf0CDSvixTX6KS6LJVxYLTw6/cYR6poY/JjbcOSx6ASUJlGzccFh2aIBjrmH7ISZzsChB/KIJmwoh4/5WWRl0ShILDjbpOyqmNz0m6xYr1WnG6ECAOERqIrf9y3dbahM3drpHhHdqBerhOMvf/iNeXk6DSbKk8Pr4Z6Bck61xPoNMfekgmQ/vShuqtRalqjk0e39D79EIXPgEuLImTNfau "Residencia de Estudiantes, Madrid (Spain). (a) Views of the Pabellones Gemelos, (b) General scheme adapted from [32].")
Residencia de Estudiantes, Madrid (Spain). (a) Views of the Pabellones Gemelos, (b) General scheme adapted from [32].
The soil in Madrid or Madrid facies are basin edge deposits consisting mainly of quartz-feldspathic sands and silty clays. In this detrital set, two different units can be distinguished, depending on the content of fines. The upper material (from the Terciary of Madrid) is constituted by the unit of Miocene “arenas de miga”, in its geotechnical characterization (detrial materials – arkose–) and “Toscoh” that are arkose with intercalations of brown clays – that define the facies of Madrid [33]. The above description of the soil is a general explanation that does not necessarily represent the characteristics of the ground where the buildings are located.
In order to compare both CH buildings, Table 1 shows the main characteristics of the two cases studied (Puerta Elvira and Pabellón Gemelo of the Residencia de Estudiantes).
Comparative table of the main characteristics of Puerta Elvira and Residencia de Estudiantes.
| Puerta Elvira | Residencia de Estudiantes | |
|---|---|---|
| Location | Granada (Spain) | Madrid (Spain) |
| Main construction material | Rammed earth | Brick |
| Main material deterioration | Brick masonry | Brick masonry |
| Construction/Restoration with brick masonry | 1957 | 1913 |
| Soil type | Alhambra conglomerate | Garden |
| Floor insulation | Yes | No |
| Hazard | Earthquakes, freeze–thaw cycles, storms, erosion of material over time (for example, collision of particles moved by wind, etc.), pollution due to daily traffic. | Soluble salts from the soil, fertilizer, freeze–thaw cycles, storms, erosion of material over time (for example, collision of particles moved by wind, etc.) pollution due to daily traffic. |
| Orientation | EW | NS |
Samples of pieces of detached brick have been collected at each structure, Puerta Elvira and the Residencia de Estudiantes. These were damaged bricks since in none of the structures there was no interaction with their walls.
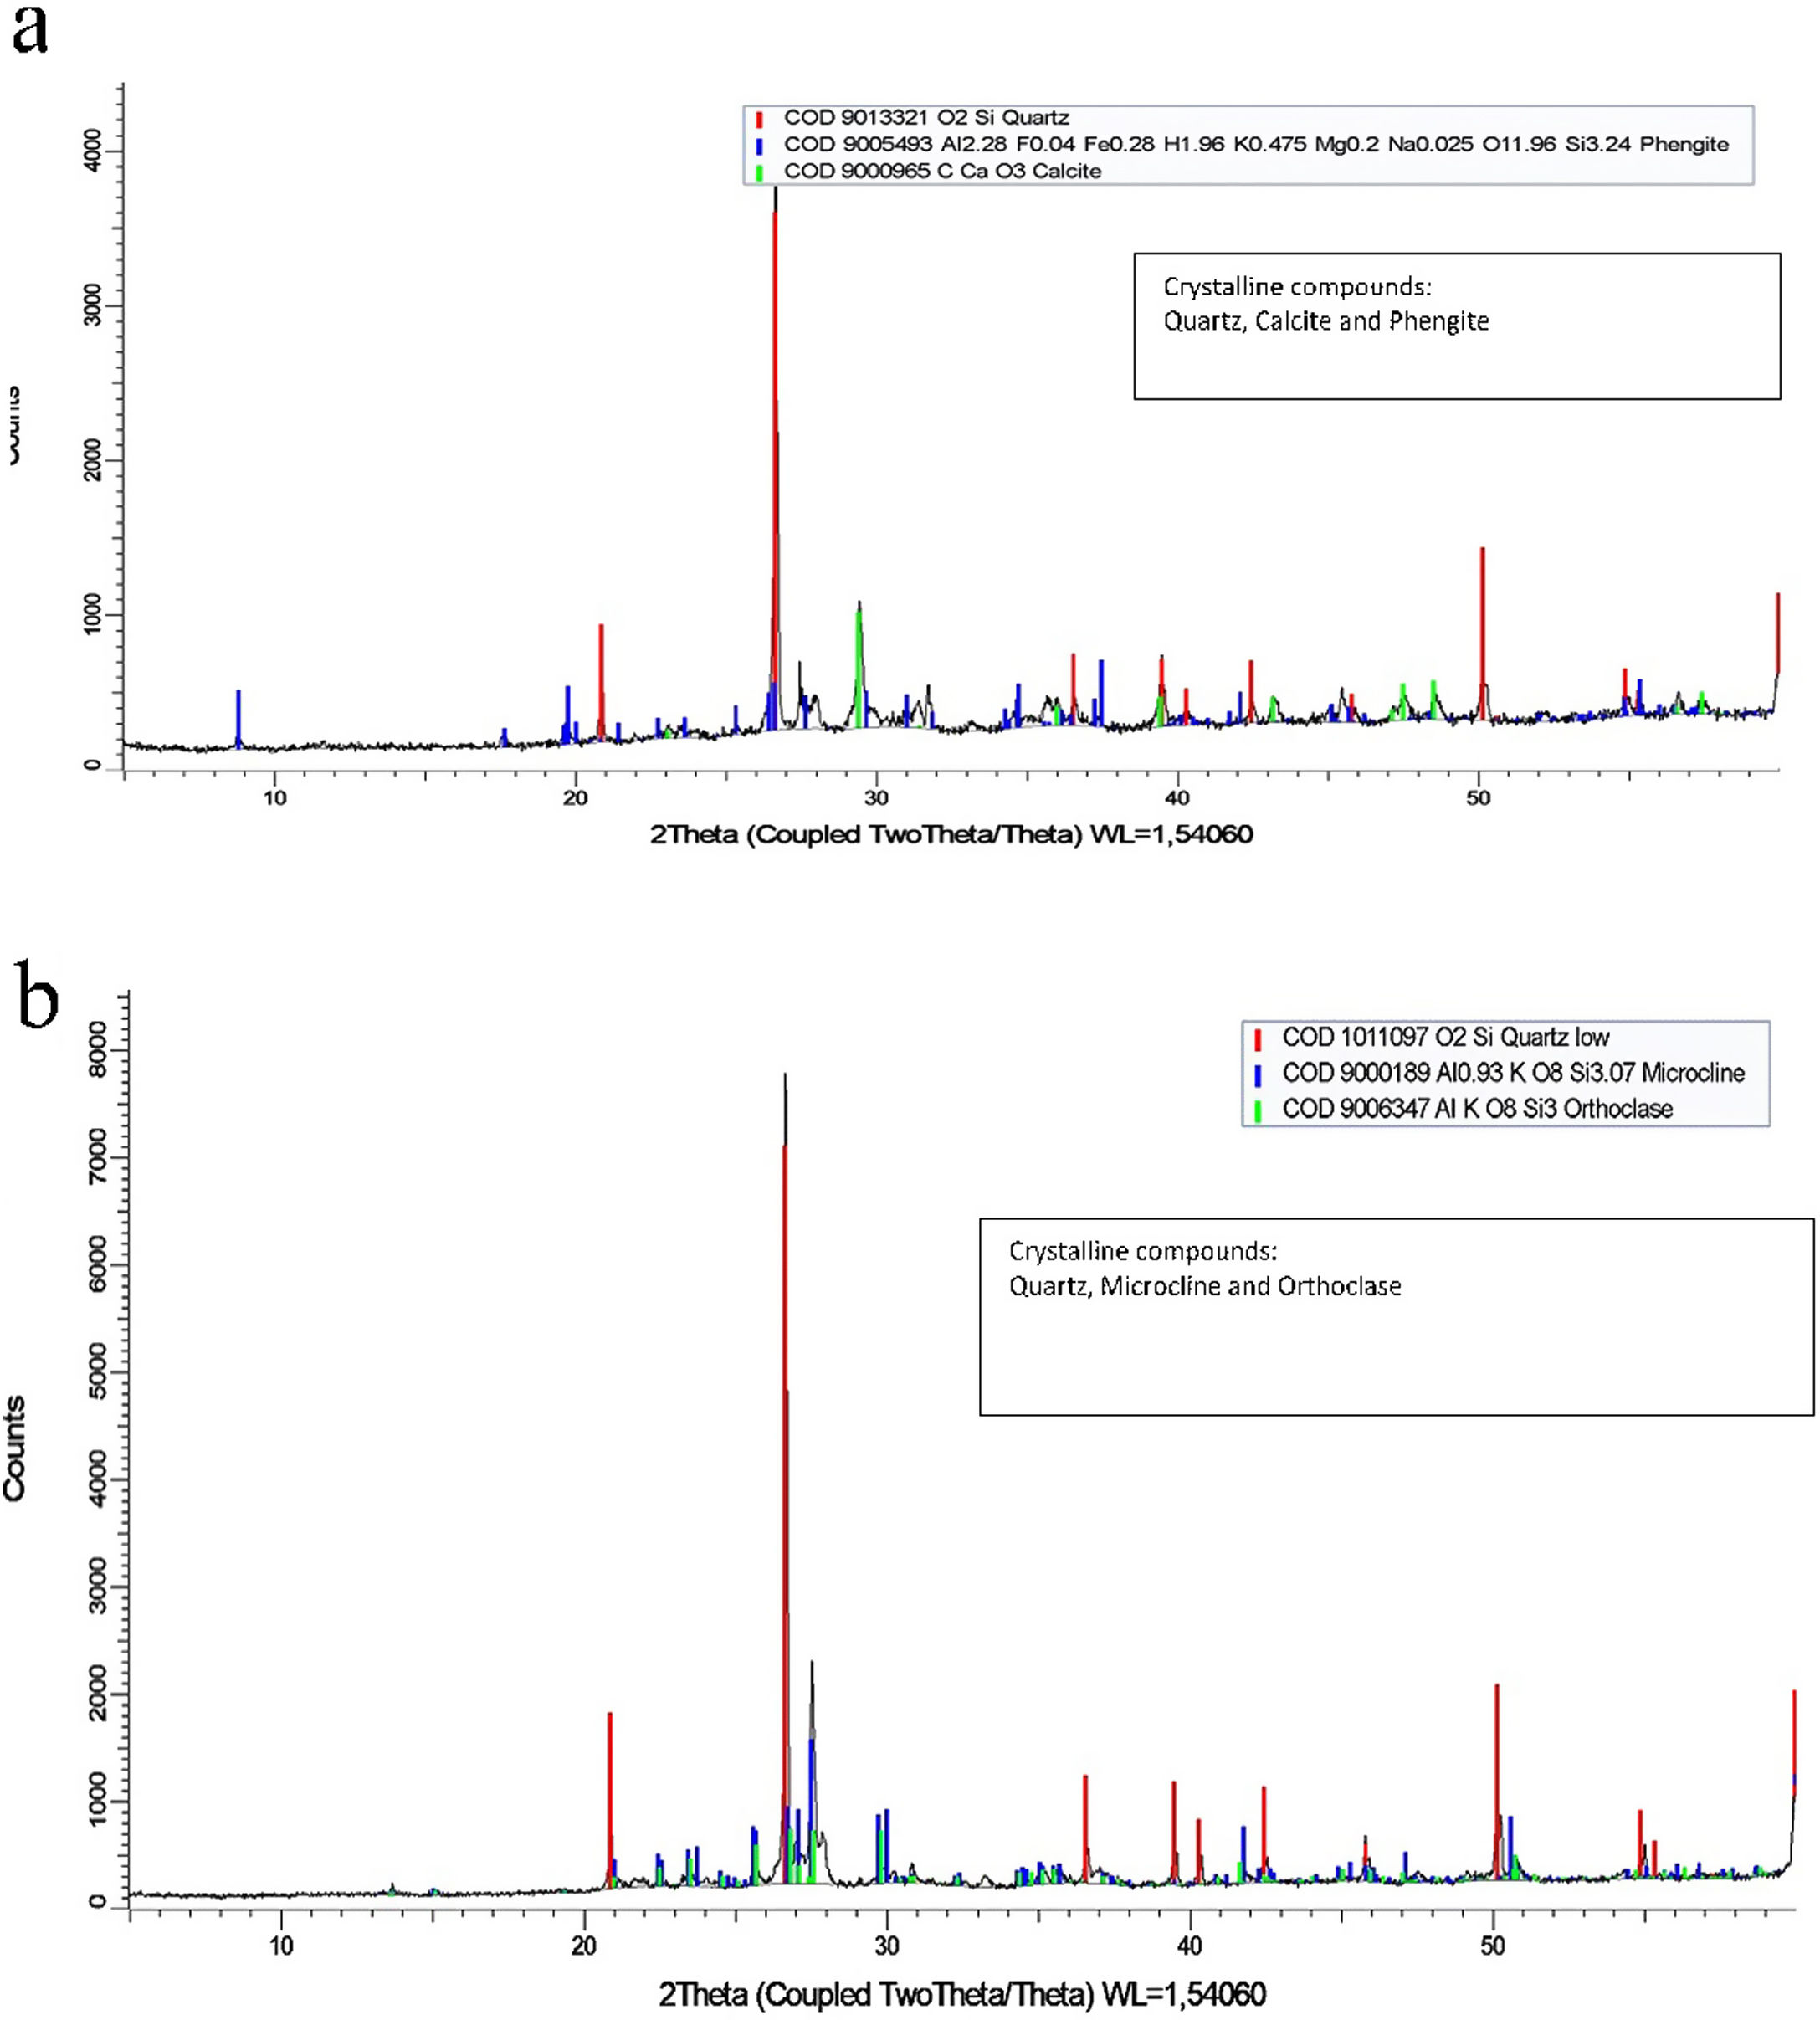
XRD resultsThe results of the X-ray diffraction tests are represented in Fig. 5. Table 2 shows the major and minor components observed by X-ray diffraction.
 Puerta Elvira. (b) Residencia de Estudiantes.")
Fig. 5a and b, and Table 2 show that the mineralogical composition in both bricks is similar. Quartz is the majority component in both samples. On the other hand, micas and feldspars are the minor crystalline components.
In addition, it should be noted that a significant amount of calcium carbonate can be observed in the form of calcite in brick from Puerta Elvira. This calcite cannot be associated with the composition of the brick.
XRF resultsThe chemical composition of the bricks, expressed in the form of the most stable oxide, was determined by XRF with a model S8 Tigger 4kW instrument (Bruker, Billerica, MA, USA). Additionally, and in order to determine compounds associated with environmental pollution such as nitrites, nitrates and carbon dioxide, complementary chemical analysis methods such as gravimetry, potentiometry, loss on ignition and ion chromatography are used. The chemical composition of the bricks analyzed in term of the most stable oxides is shown in Table 3.
Chemical composition of Puerta Elvira and Residencia de Estudiantes bricks.
| Technique | Component | Puerta Elvira (Granada) | Residencia de Estudiantes (Pabellón Gemelo) |
|---|---|---|---|
| FRX (melted) | SiO2 | 58.62% | 72.27% |
| Al2O3 | 18.60% | 15.39% | |
| Fe2O3 | 6.39% | 2.59% | |
| CaO | 3.47% | 1.35% | |
| MgO | 5.15% | 0.00% | |
| Na2O | 2.44% | 2.24% | |
| K2O | 2.64% | 4.83% | |
| TiO2 | 0.87% | 0.36% | |
| P2O5 | 0.17% | 0.13% | |
| Gravimetry | SO3 | 0.55% | 0.00% |
| Potentiometry | Cl− | 0.11% | 0.00% |
| FRX (melted) | MnO | 0.09% | 0.05% |
| ZnO | 0.03% | 0.00% | |
| SrO | 0.07% | 0.01% | |
| ZrO2 | 0.03% | 0.02% | |
| BaO | 0.12% | 0.00% | |
| Rb2O | 0.00% | 0.05% | |
| Loss on ignition | CO2 | 0.54% | 0.72% |
| Extraction in water (Ion Chromatography) | NO2− | 0.00% | 0.00% |
| NO3− | 0.12% | 0.00% |
Table 3 shows that the chemical composition of the two types of bricks analyzed is, in general terms, relatively similar. Silica, aluminium, iron, carbon, sodium, and potassium are the most abundant components in both samples.
The difference in the chemical composition related to the SiO2 content in the bricks studied can be explained by the greater quantity of soluble salts at Puerta Elvira. The chemical composition of the Puerta Elvira brick has been corrected by subtracting the calcite content determined by TGA.
Leaching test resultsThe leaching test was performed, as explained above, in order to evaluate the potential extraction of salts and leached alkalis from both brick samples.
The results obtained are summarized in Table 4, expressed in percentages. The results consider the leachable salts that contain nitrates, nitrites, chlorides, and phosphates, as well as leached alkalis, in accordance with the criteria established in [34]. Sulfate leaching has also been determined but it is not considered in the total sum of extractable salts, since it can come from the composition of the actual brick itself.
Results of leaching test for the two samples studied.
| Leached salts | Leached salts | Puerta Elvira | Residencia de estudiantes |
|---|---|---|---|
| ICP | K2O | 4.9×10⁻¹ (%) | 1.3×10⁻³ (%) |
| Na2O | 2.0×10⁻¹ (%) | 2.0×10⁻³ (%) | |
| Potentiometry | Cl− | 2.2×10⁻² (%) | 1.1×10⁻³ (%) |
| Chromatography | NO2 | 1.0×10⁻⁴ (%) | 1.3×10⁻⁶ (%) |
| NO3 | 1.8×10⁻² (%) | 2.1×10⁻⁵ (%) | |
| P2O5 | 0.0 (%) | 1.7×10⁻⁶ (%) | |
| Total | 7.7×10⁻¹ (%) | 3.5×10⁻² (%) | |
The results in Table 4 show that there is a much higher quantity of soluble salts at Puerta Elvira than at the Residencia de Estudiantes. This is associated with environmental exposure and the type of soil on which the two structures are based. The nitrites and nitrates observed at Puerta Elvira are associated with organic contamination. At Puerta Elvira, the chloride ion is associated with the use of de-icing salts in winter. The authors assume that the phosphates come from fertilizers, which is why they are only detected in the soil of the Residencia de Estudiantes, which is located on a meadow. Sodium and potassium ions are observed at both structures, and the values are much higher at Puerta Elvira, which may also be associated with the use of de-icing salts.
Porosity accessible to water resultsResults of the porosity test are summarized in Table 5. Obtained through dry, saturated, and submerged weights, the porosity is expressed in percentages. The results of the apparent density and the real density are also expressed.
Environmental exposureThe mean values of the different environmental exposure parameters analyzed and the maximum temperature variation have been calculated. The values are summarized in Table 6.
Average environmental parameters in the last 40 years.
| Environmental parameters | Puerta Elvira (Granada) | Residencia de Estudiantes (Madrid) |
|---|---|---|
| Maximum Temperature | 39.7°C | 37.9°C |
| Minimum Temperature | −5.7°C | −2.5°C |
| Temperature variation | 56.8°C | 48.0°C |
| Wind, maximum wind gust | 79.7km/h | 78.9km/h |
| Rain, average rainfall | 362.5mm | 391.6mm |
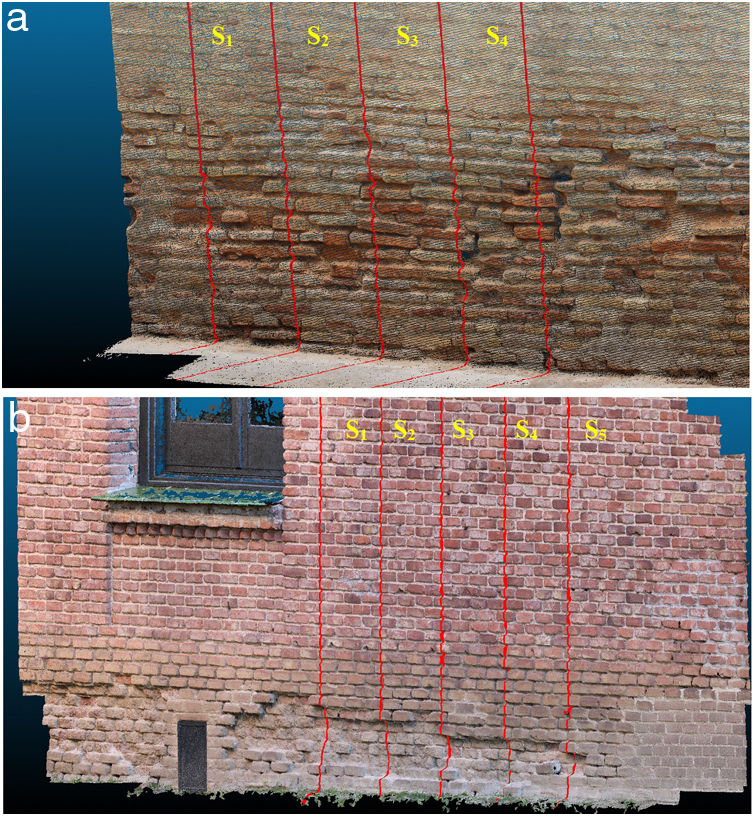
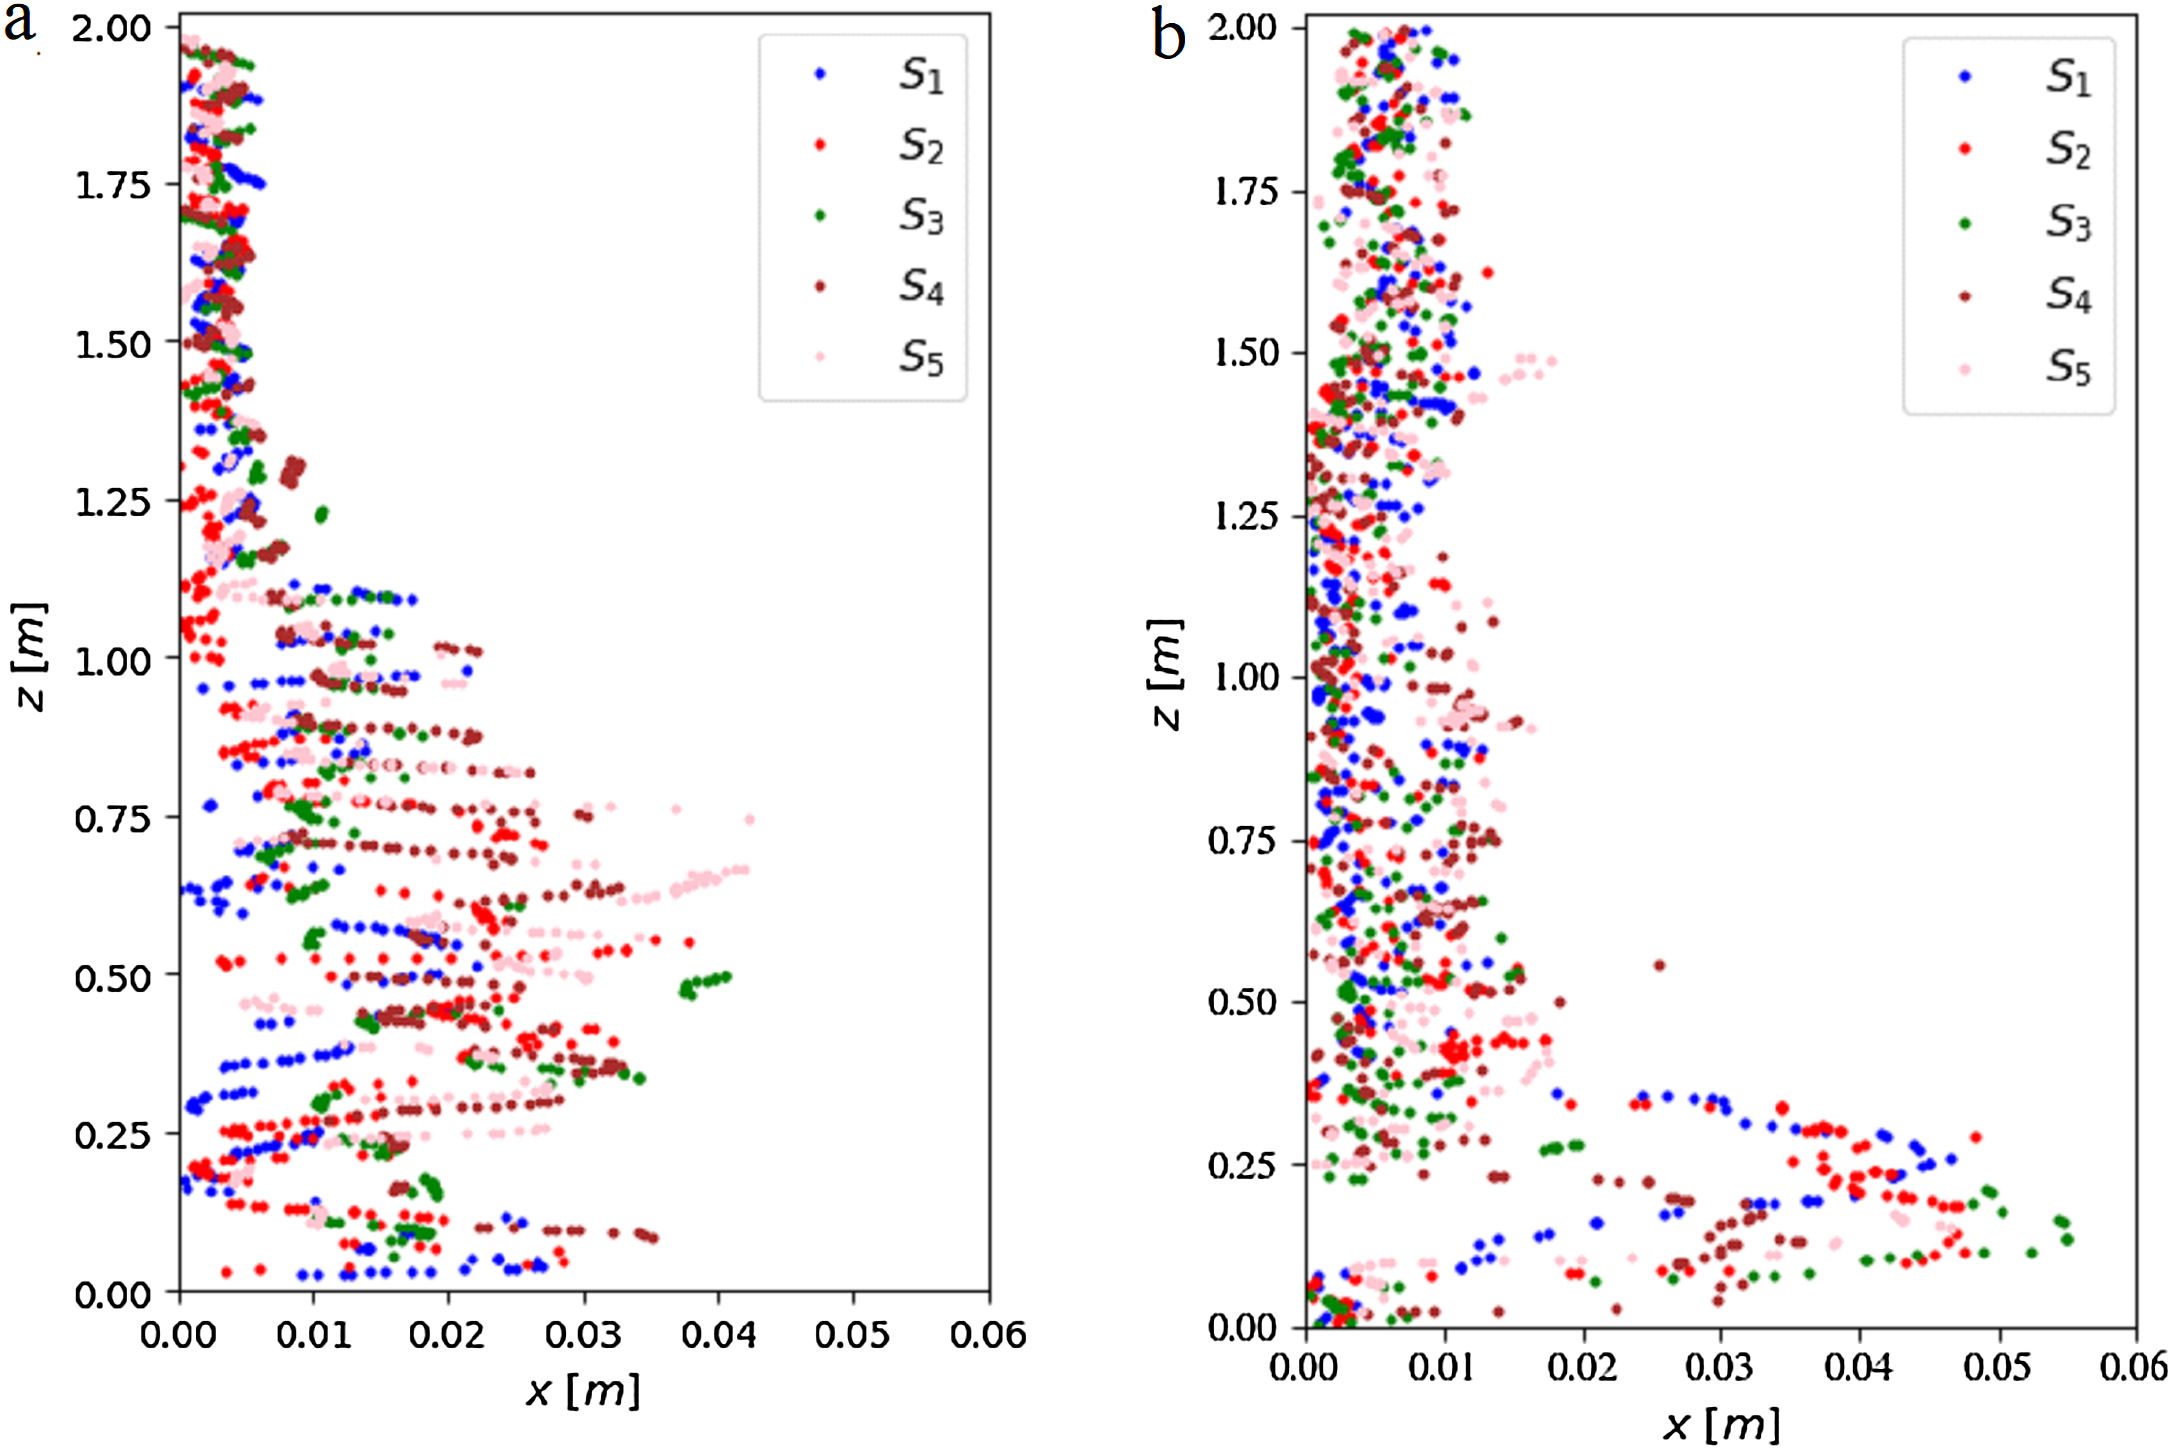
The photogrammetric point cloud (PPC) has been obtained by using the methodology described in [9], and it is shown with the selected sections of both CH buildings in Fig. 6. The photogrammetric data zD has been obtained up to 2m above ground level, since this measurement contains two different degradation areas in both buildings. In both cases, the same number of degradation profiles (S1, S2, S3, S4, S5) separated by 50cm have been considered to have the same a priori information.
 of Puerta Elvira (a) and Pabellón Gemelo of the Residencia de Estudiantes (b).")
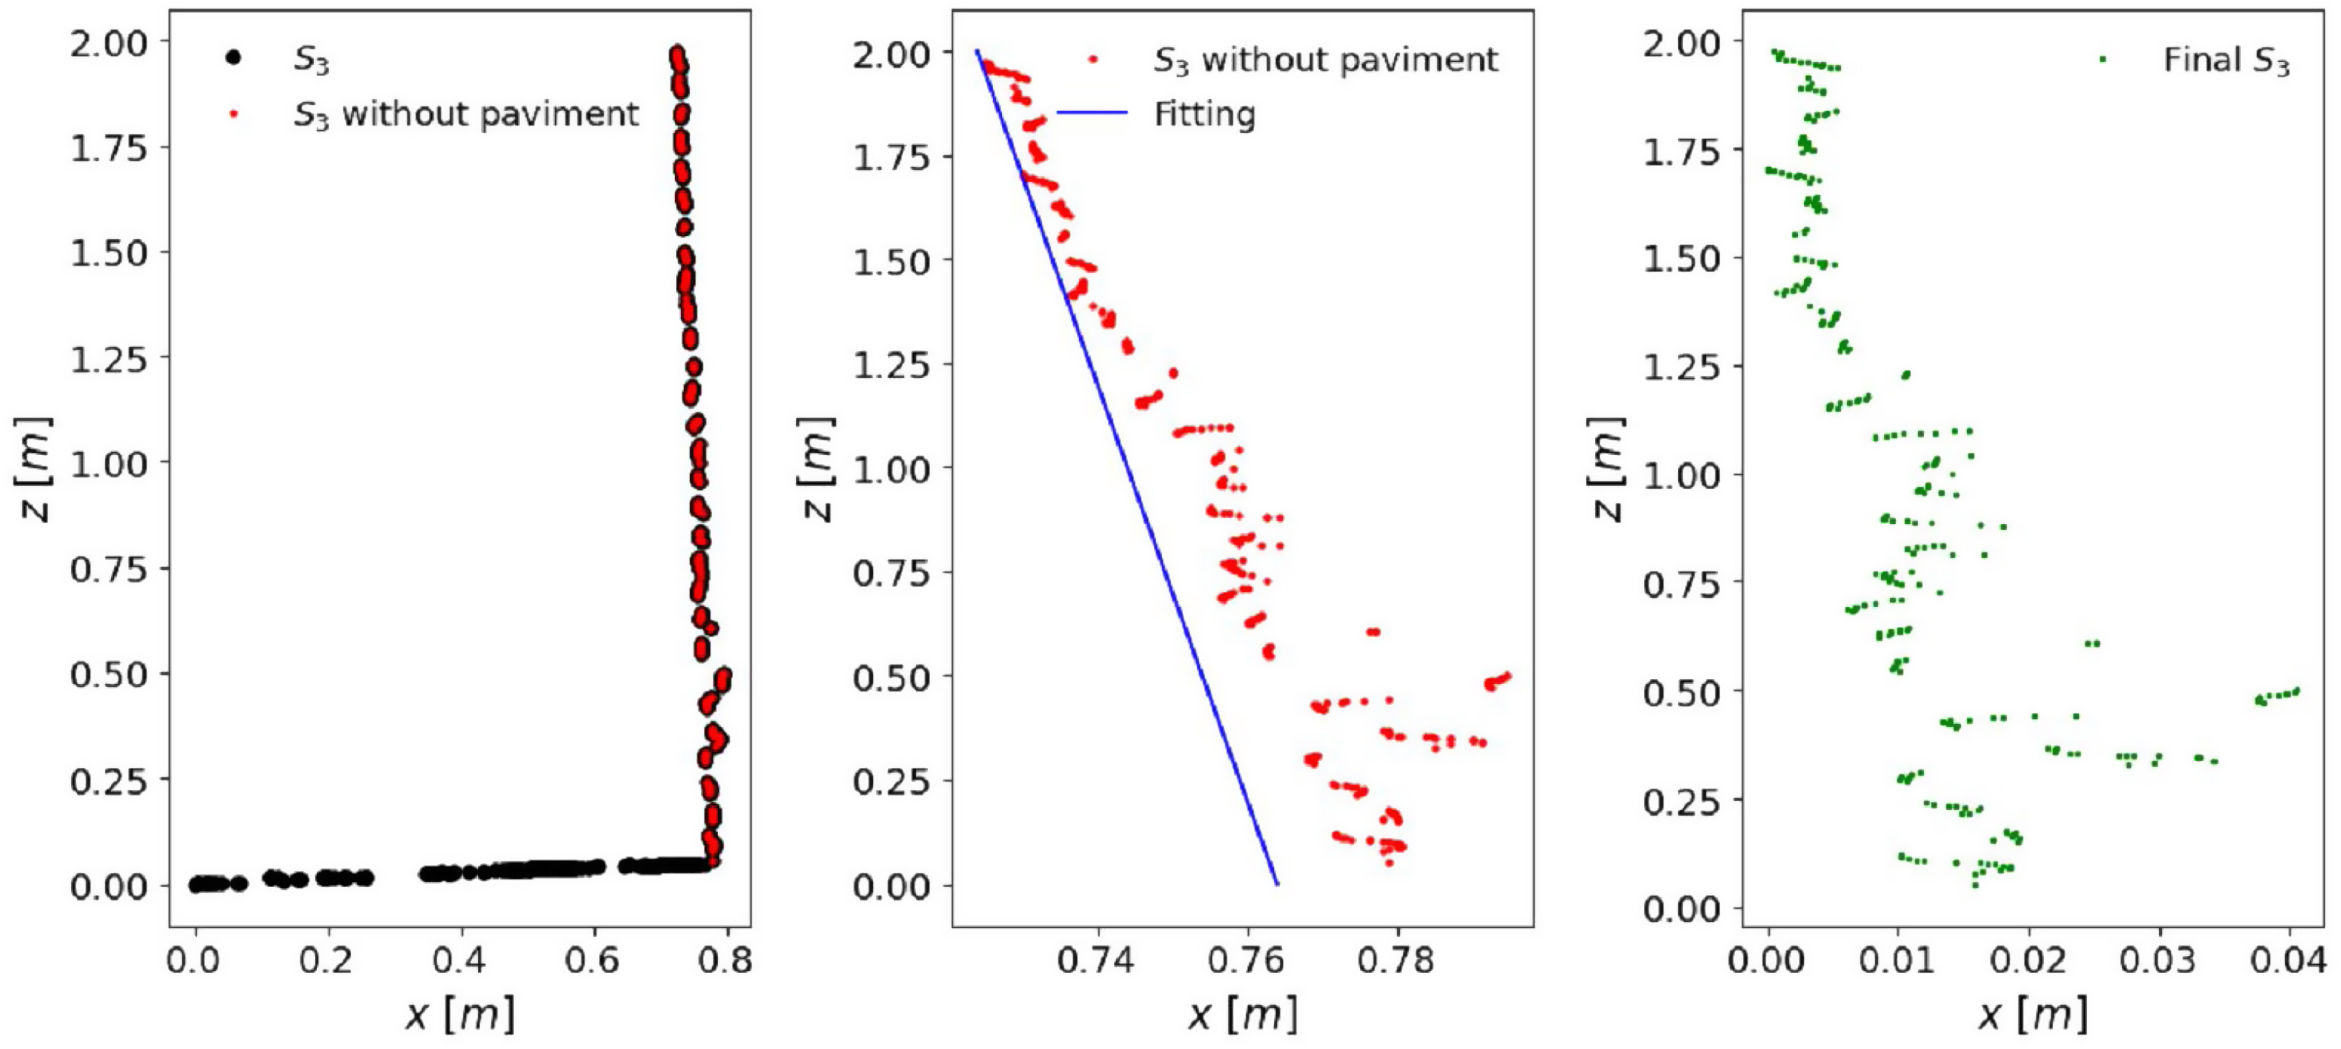
The degradation profiles have been obtained from the PPC using the CloudCompare software [35]. Preliminary data processing was carried out, removing the pavement and making a projection on the tangent line to the smallest deteriorated area. For illustrative purposes, the data processing is represented in Fig. 7 for Puerta Elvira.

The final degradation is represented in Fig. 8 for the two buildings studied. The difficulty in fitting the values of the geometry degradation parameters θ={B, H} can be seen simply by observing the data. So, the plausible values of the geometry degradation parameters θ={B, H} have been obtained in the form of the Probability Density Function p(θ|zD) using the Bayesian methodology proposed.
Surface recession patterns Puerta Elvira and (b) Pabellón Gemelo of Residencia de Estudiantes.")
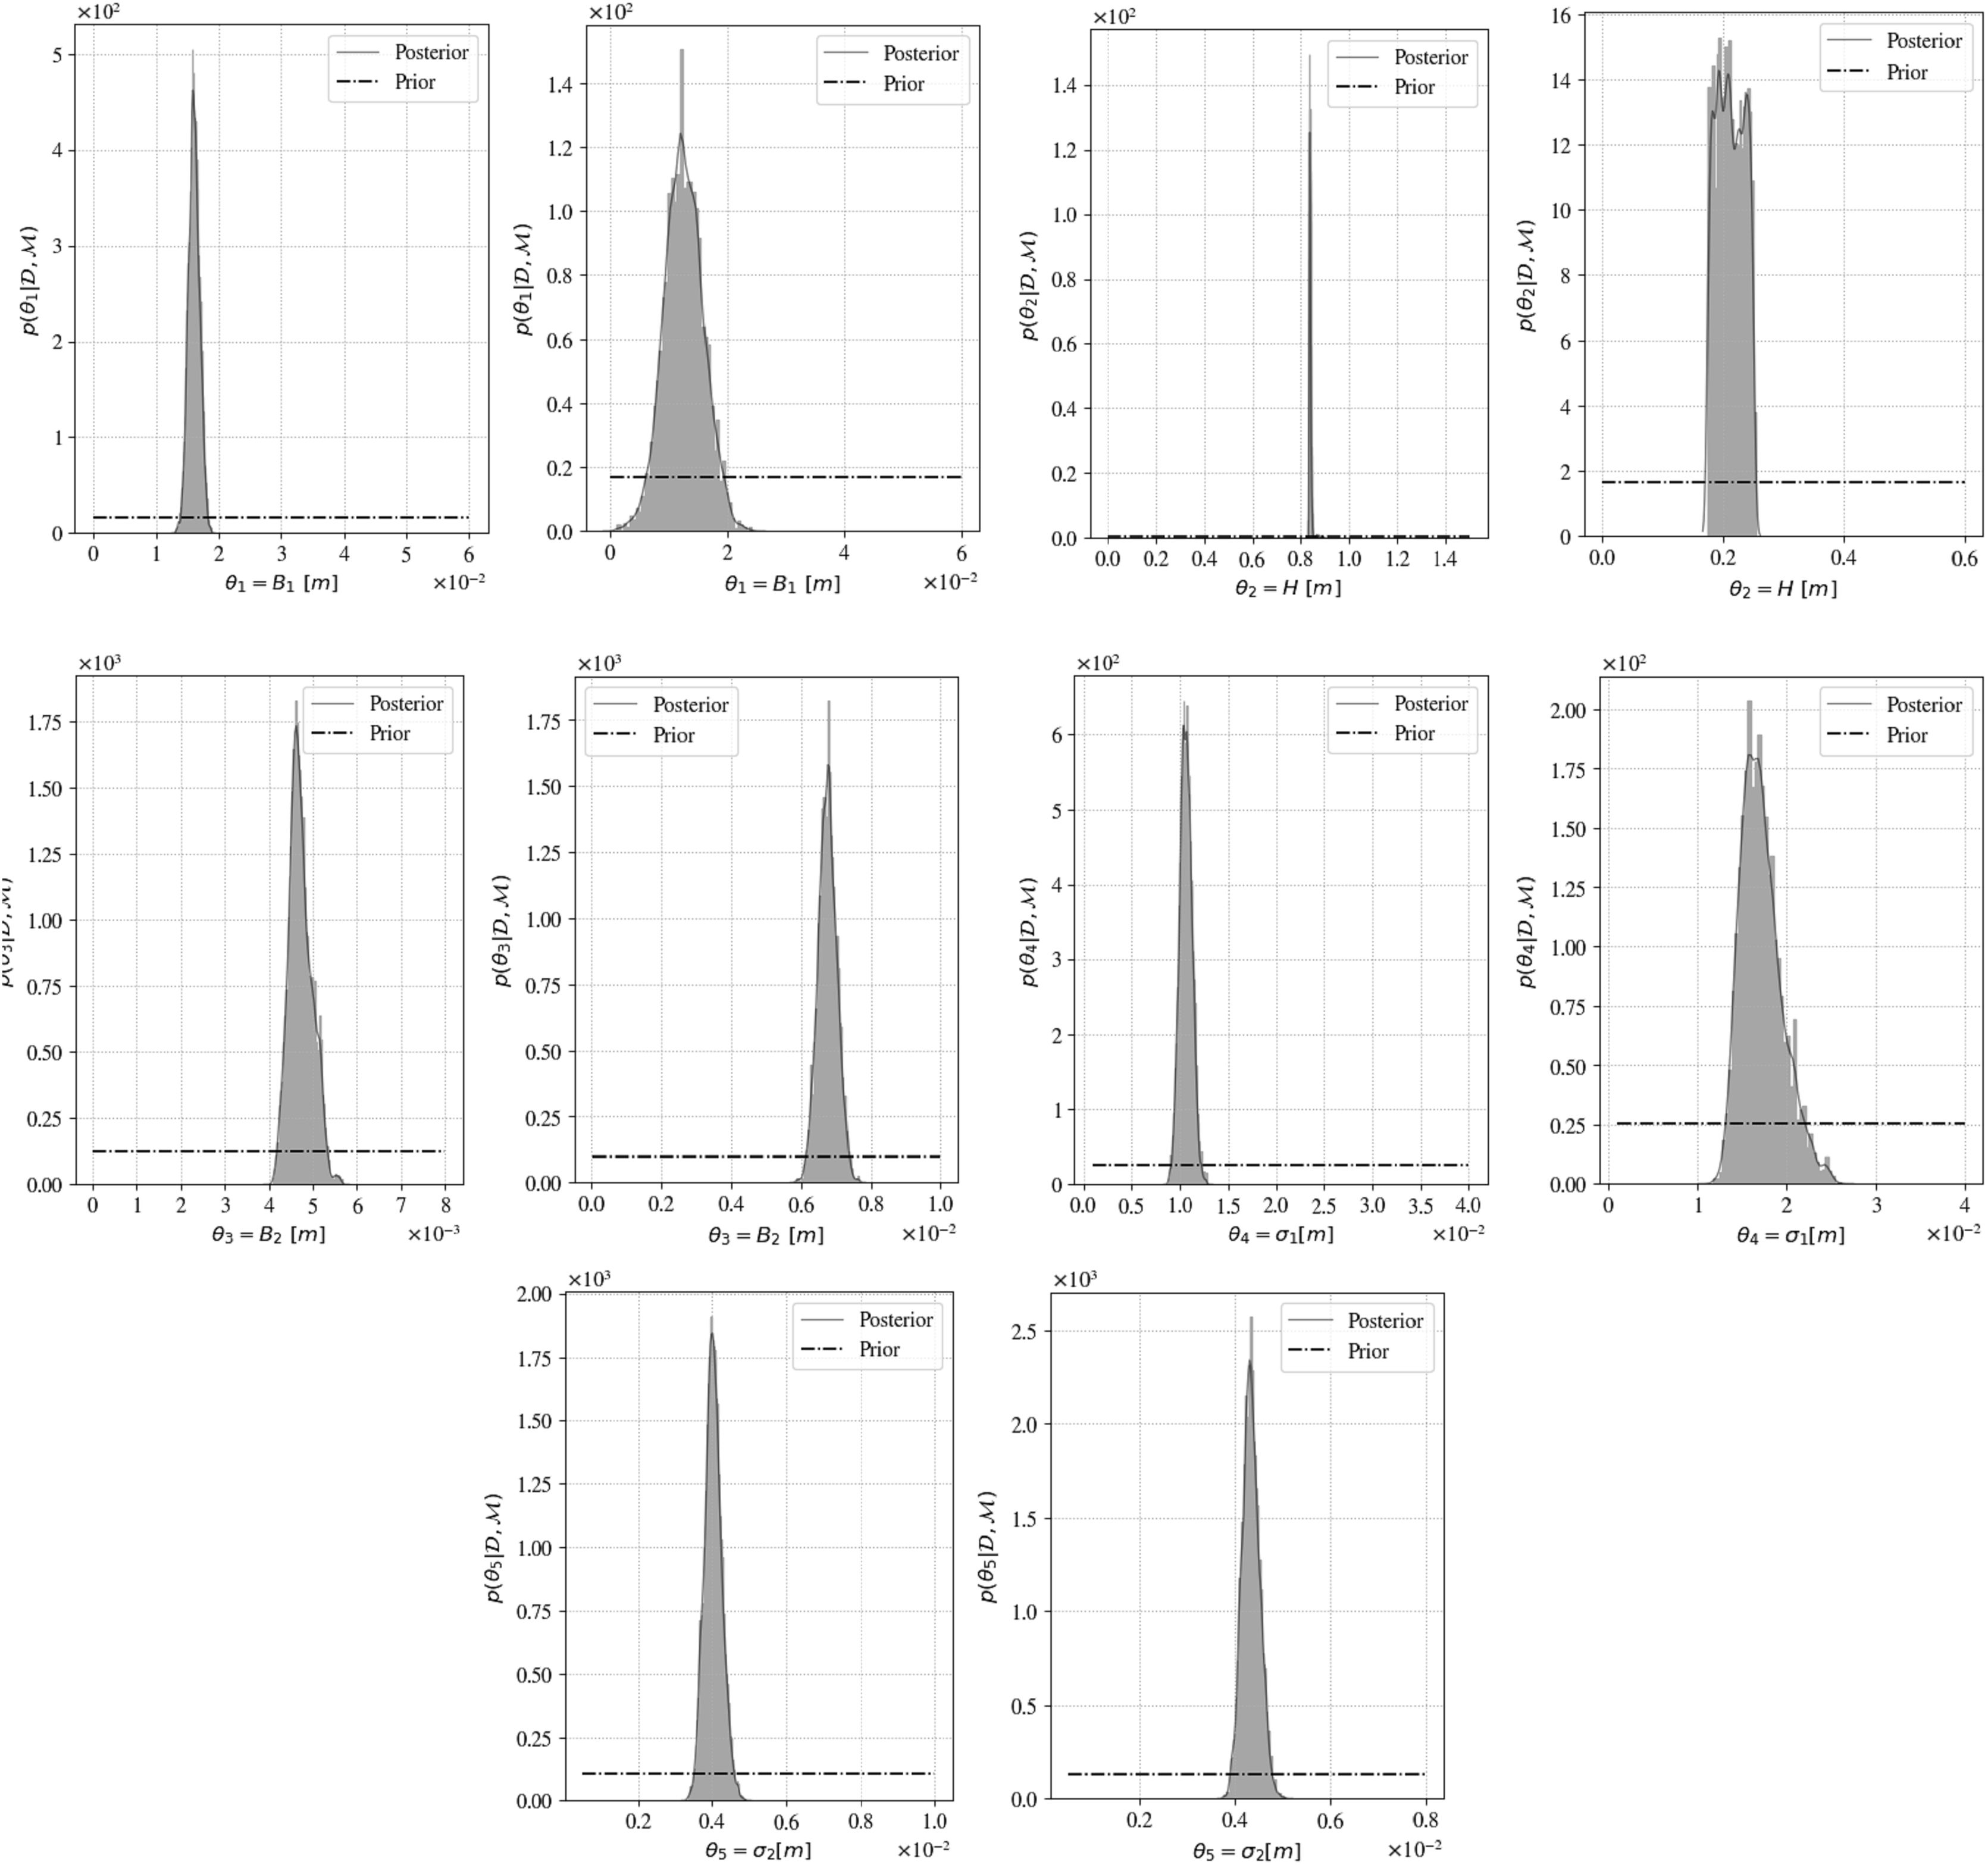
The prior information of the model parameters θ used in Eq. (3) is represented by uniform distributions and summarized in Table 7. Note that the Standard Deviation of the prediction errors σe1, σe2 is assumed to be part of the set of uncertain parameters θ.
Samples from the posterior PDFs (pθ|ZD) of the model parameters were obtained by using the M–H algorithm with 30,000 realizations in both buildings. The prior and the posterior PDF results of each individual parameter (Θ1=B1, Θ2=H, Θ3=B2, Θ4=σe1, Θ5=σe2) are represented in Fig. 9 for Puerta Elvira and Residencia de the Estudiantes. The reduction in uncertainty from the prior PDF (dashed line) to the posterior PDF (solid line) is worth noting.
 and the Pabellón Gemelo of the Residencia de Estudiantes (right).")
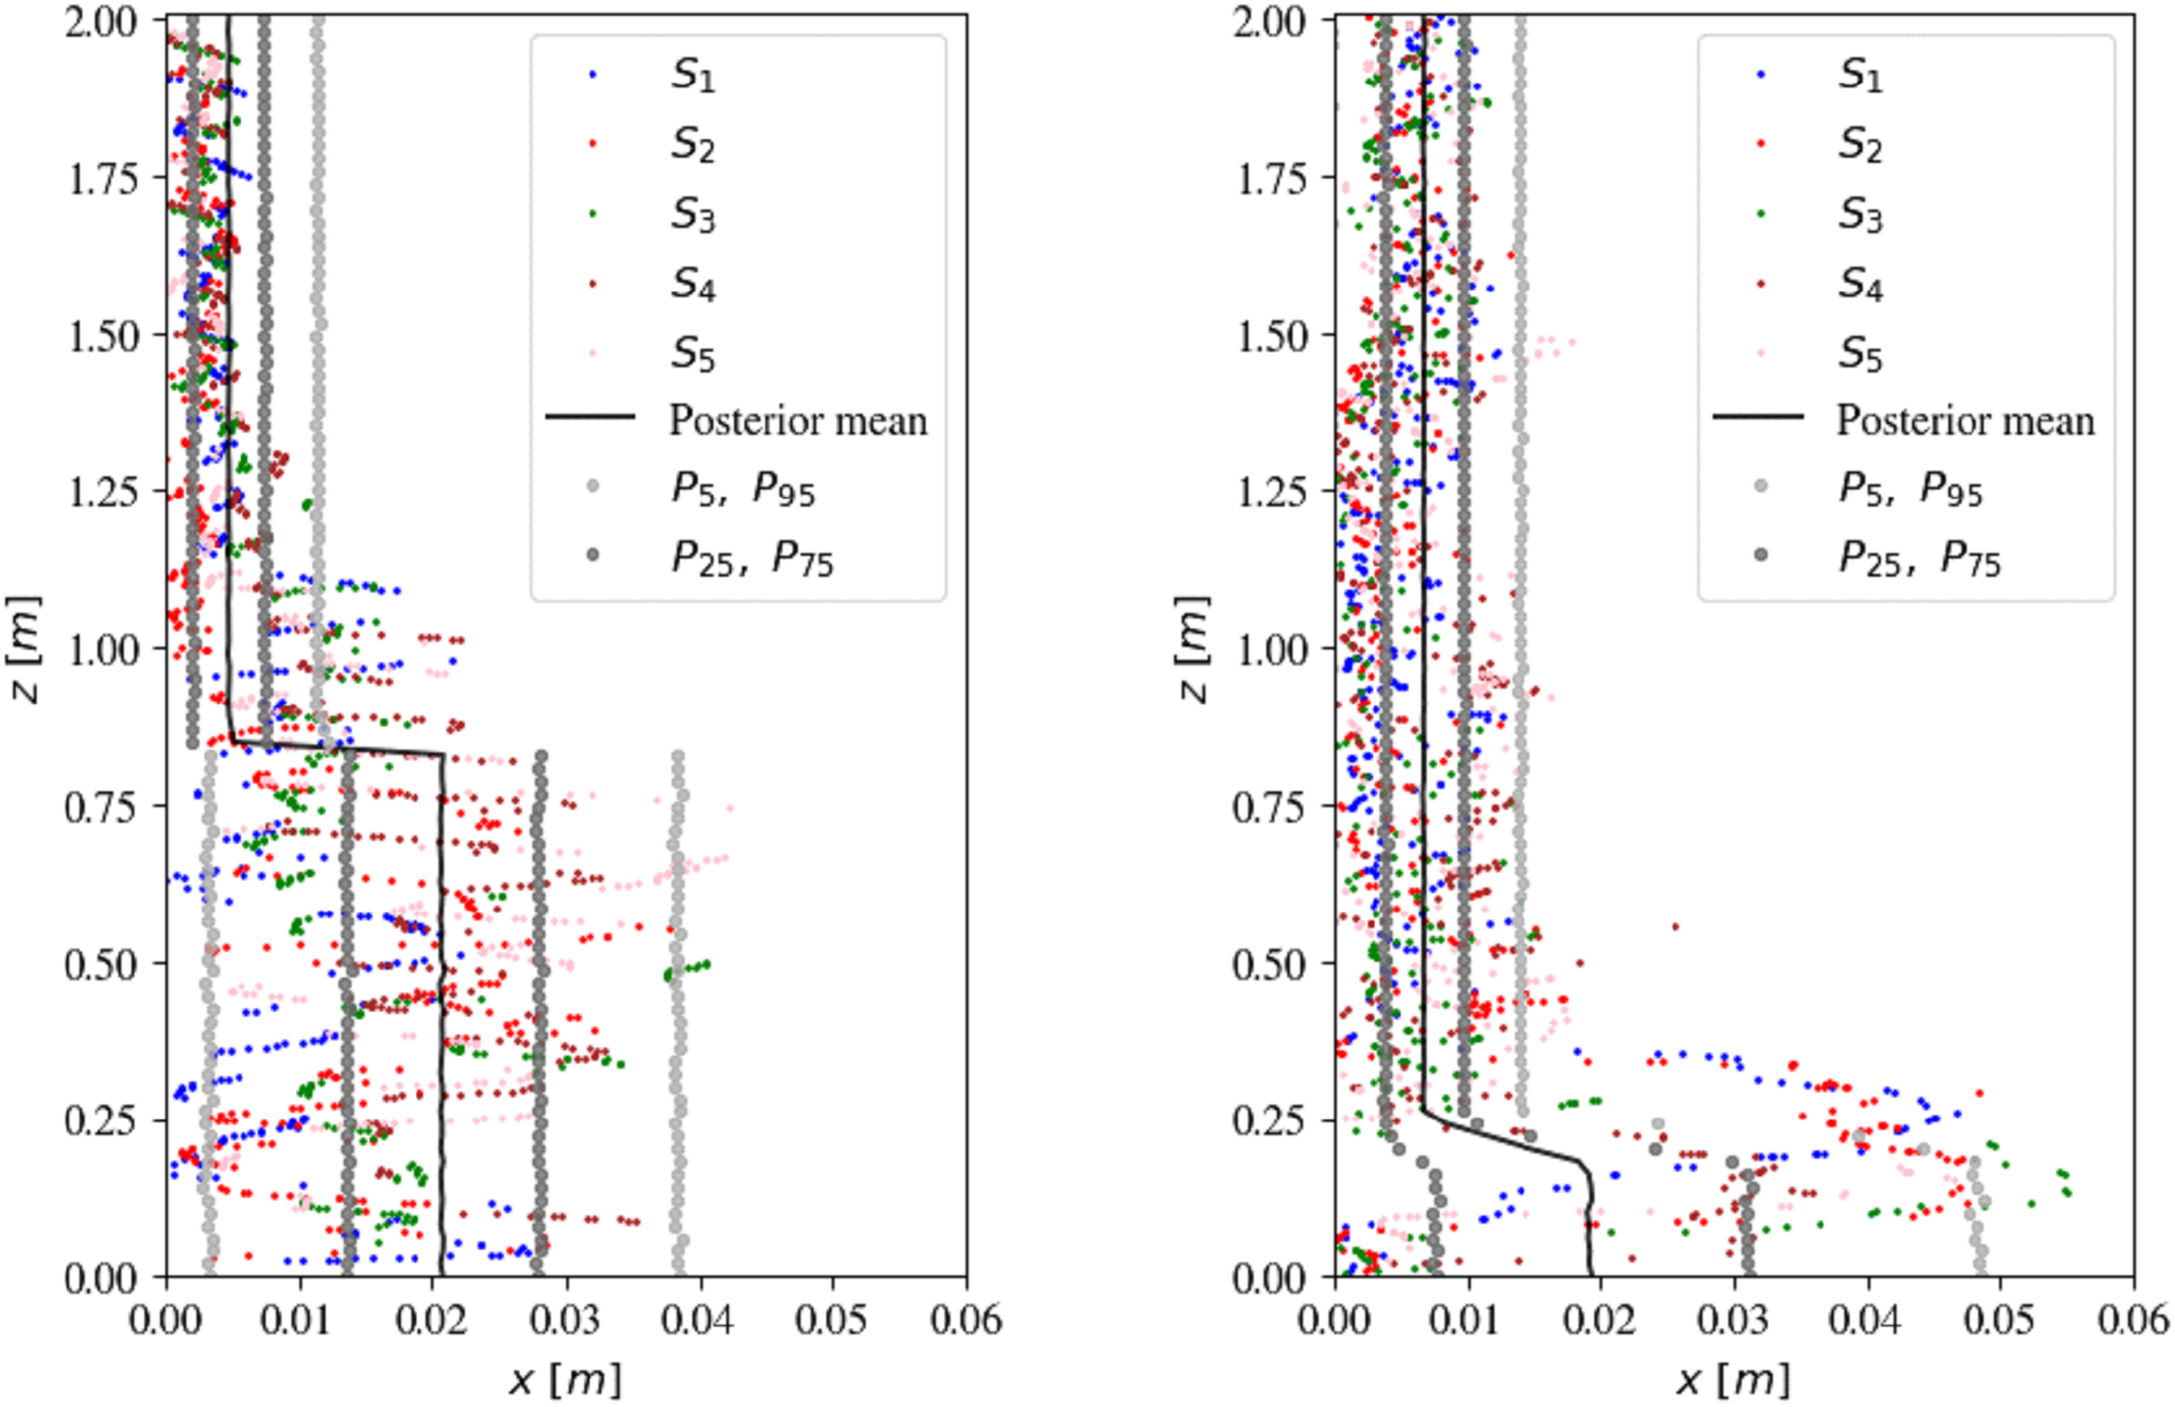
Fig. 10 represents the forward model simulation results using the posterior PDFs of the model parameters as inputs in Eq. (2) for the two buildings studied. It can be observed that the candidate degradation profile (see Fig. 2) represents the experimental data reasonably well in both cases. In addition, note that model output represents the variability and complexity in the data as two uncertainties, one in the non-deteriorated data where the uncertainty is less than the deteriorated data, which presents the highest variability and complexity. Finally, it can be concluded that the mean degradation depth is similar in both buildings, however the mean degradation height is higher in Puerta Elvira (H=0.8m) than in the Pabellón Gemelo of the Residencia de Estudiantes (H=0.25m).
 against the experimental degradation data (S1, S2, S3, S4, S5) for Puerta Elvira (left) and the Pabellón Gemelo of the Residencia de Estudiantes (right).")
Fig. 10 shows that the posterior mean degradation of the brick walls is larger in the case of Puerta Elvira than the Residencia de Estudiantes. The most significant difference is the degradation height, which is four times greater at Puerta Elvira. By assuming uniform degradation over time, Fig. 10 leads to the velocities of mean degradation indicated in Table 8.
It can be observed that the degradation is much greater in height than in depth, which indicates good brick behavior. The average degradation speed, both in height and thickness, is higher at Puerta Elvira. This seems to be related to the environmental exposure factors of the bricks.
DiscussionAt present, the brick facades show evidence of deterioration, mainly in the lower part of the walls. The deleterious effects cause damage that can be seen in the rounded corners of the bricks as shown in Fig. 6.
Different groups of parameters related to the degradation of both structures have been considered. The different groups of parameters to be correlated are grouped as:
- •
Physico-chemical factors: Total of potentially soluble compounds, CO2, soluble salts, open porosity and density.
- •
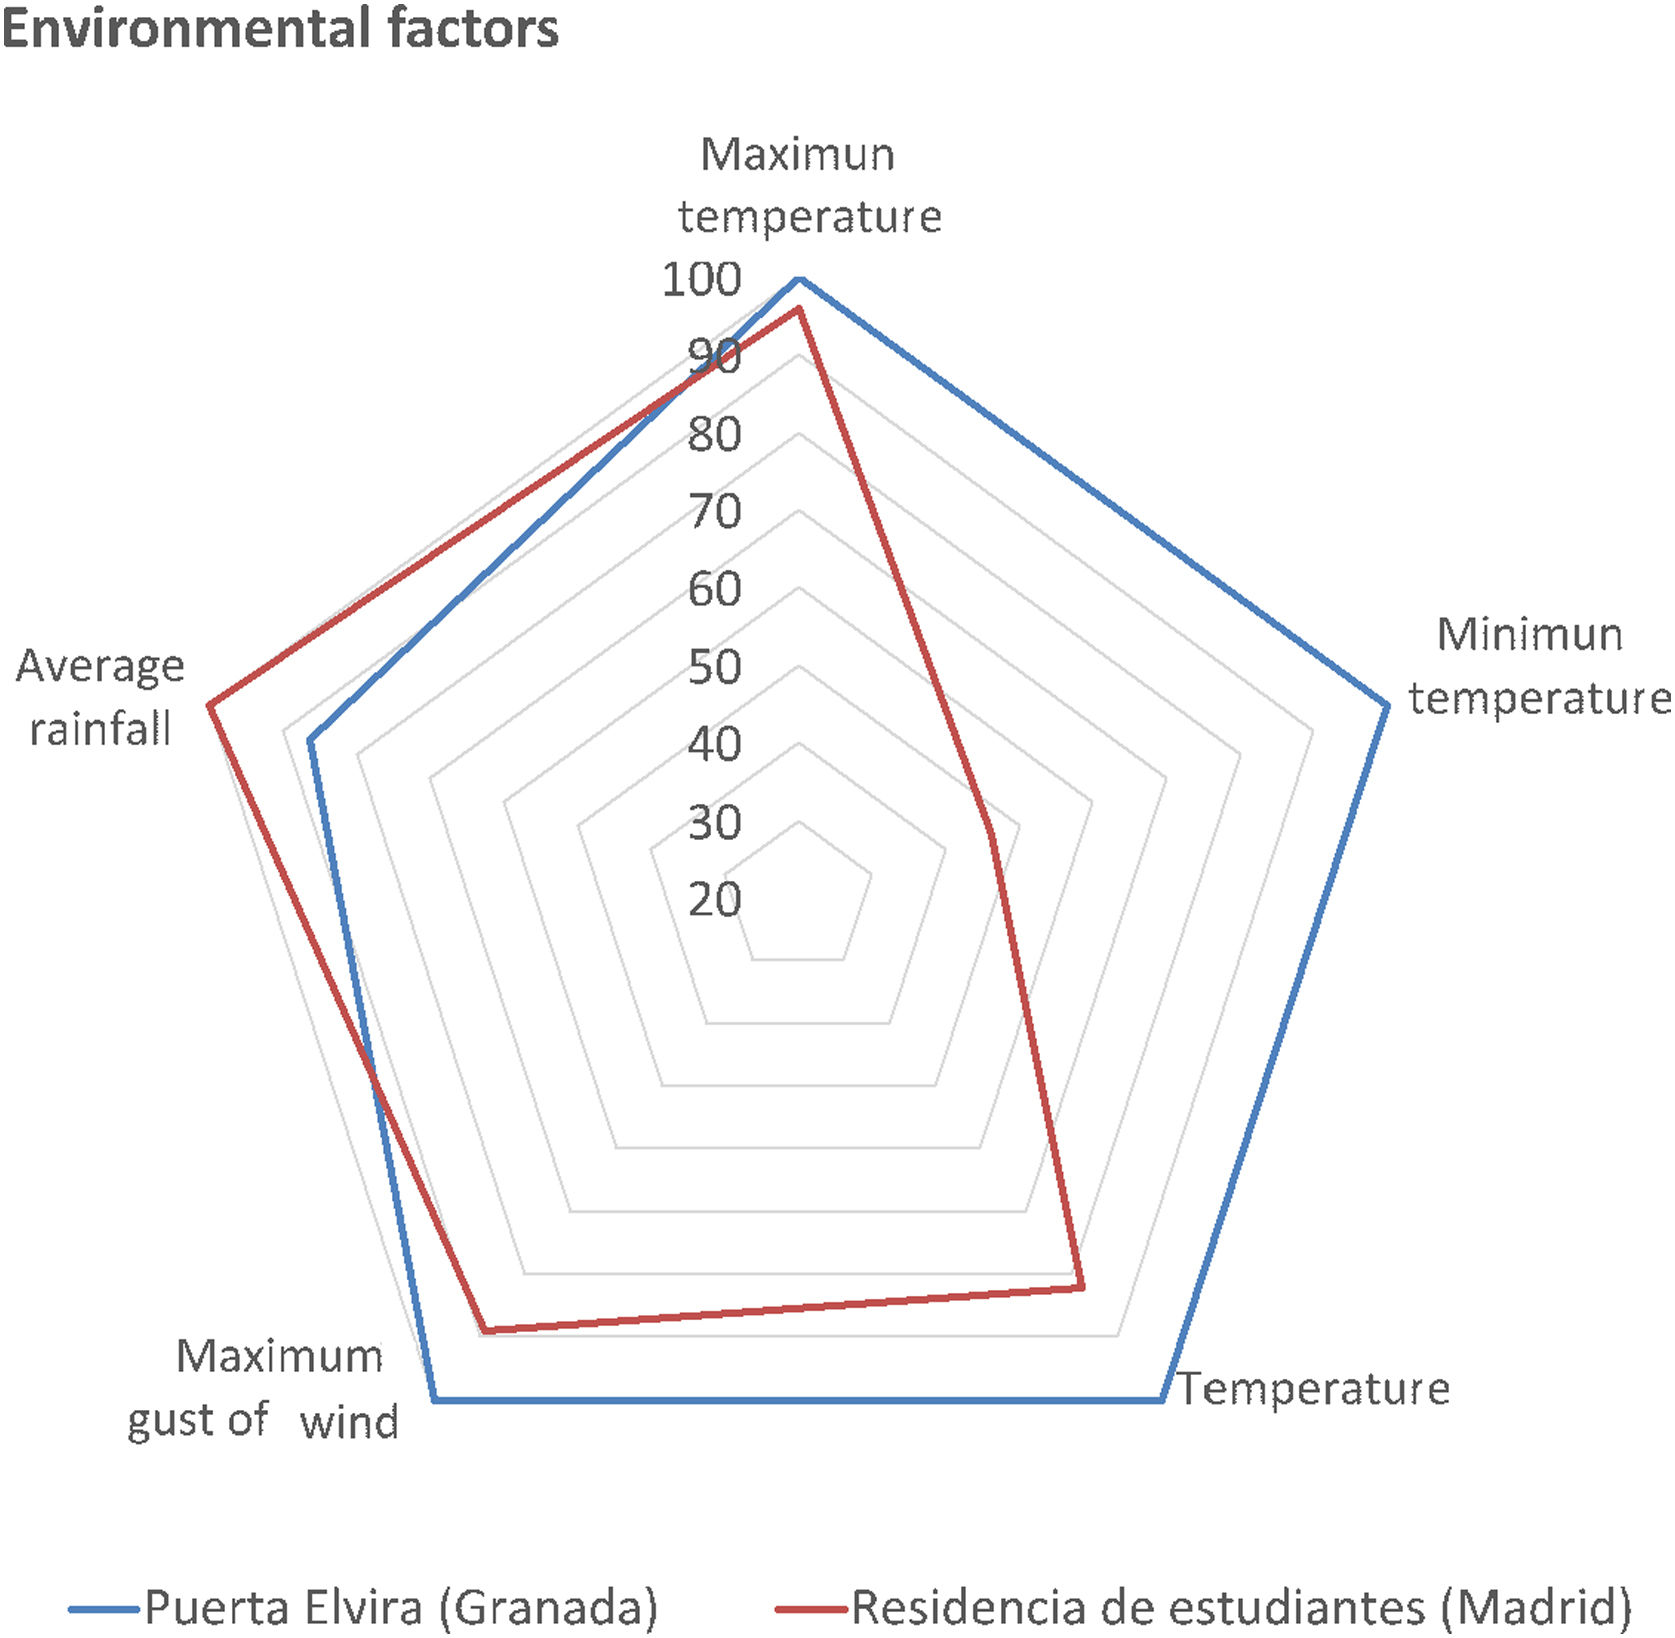
Environmental factors: Maximum temperature, minimum temperature, temperature variation, maximum wind gust and average rainfall.
- •
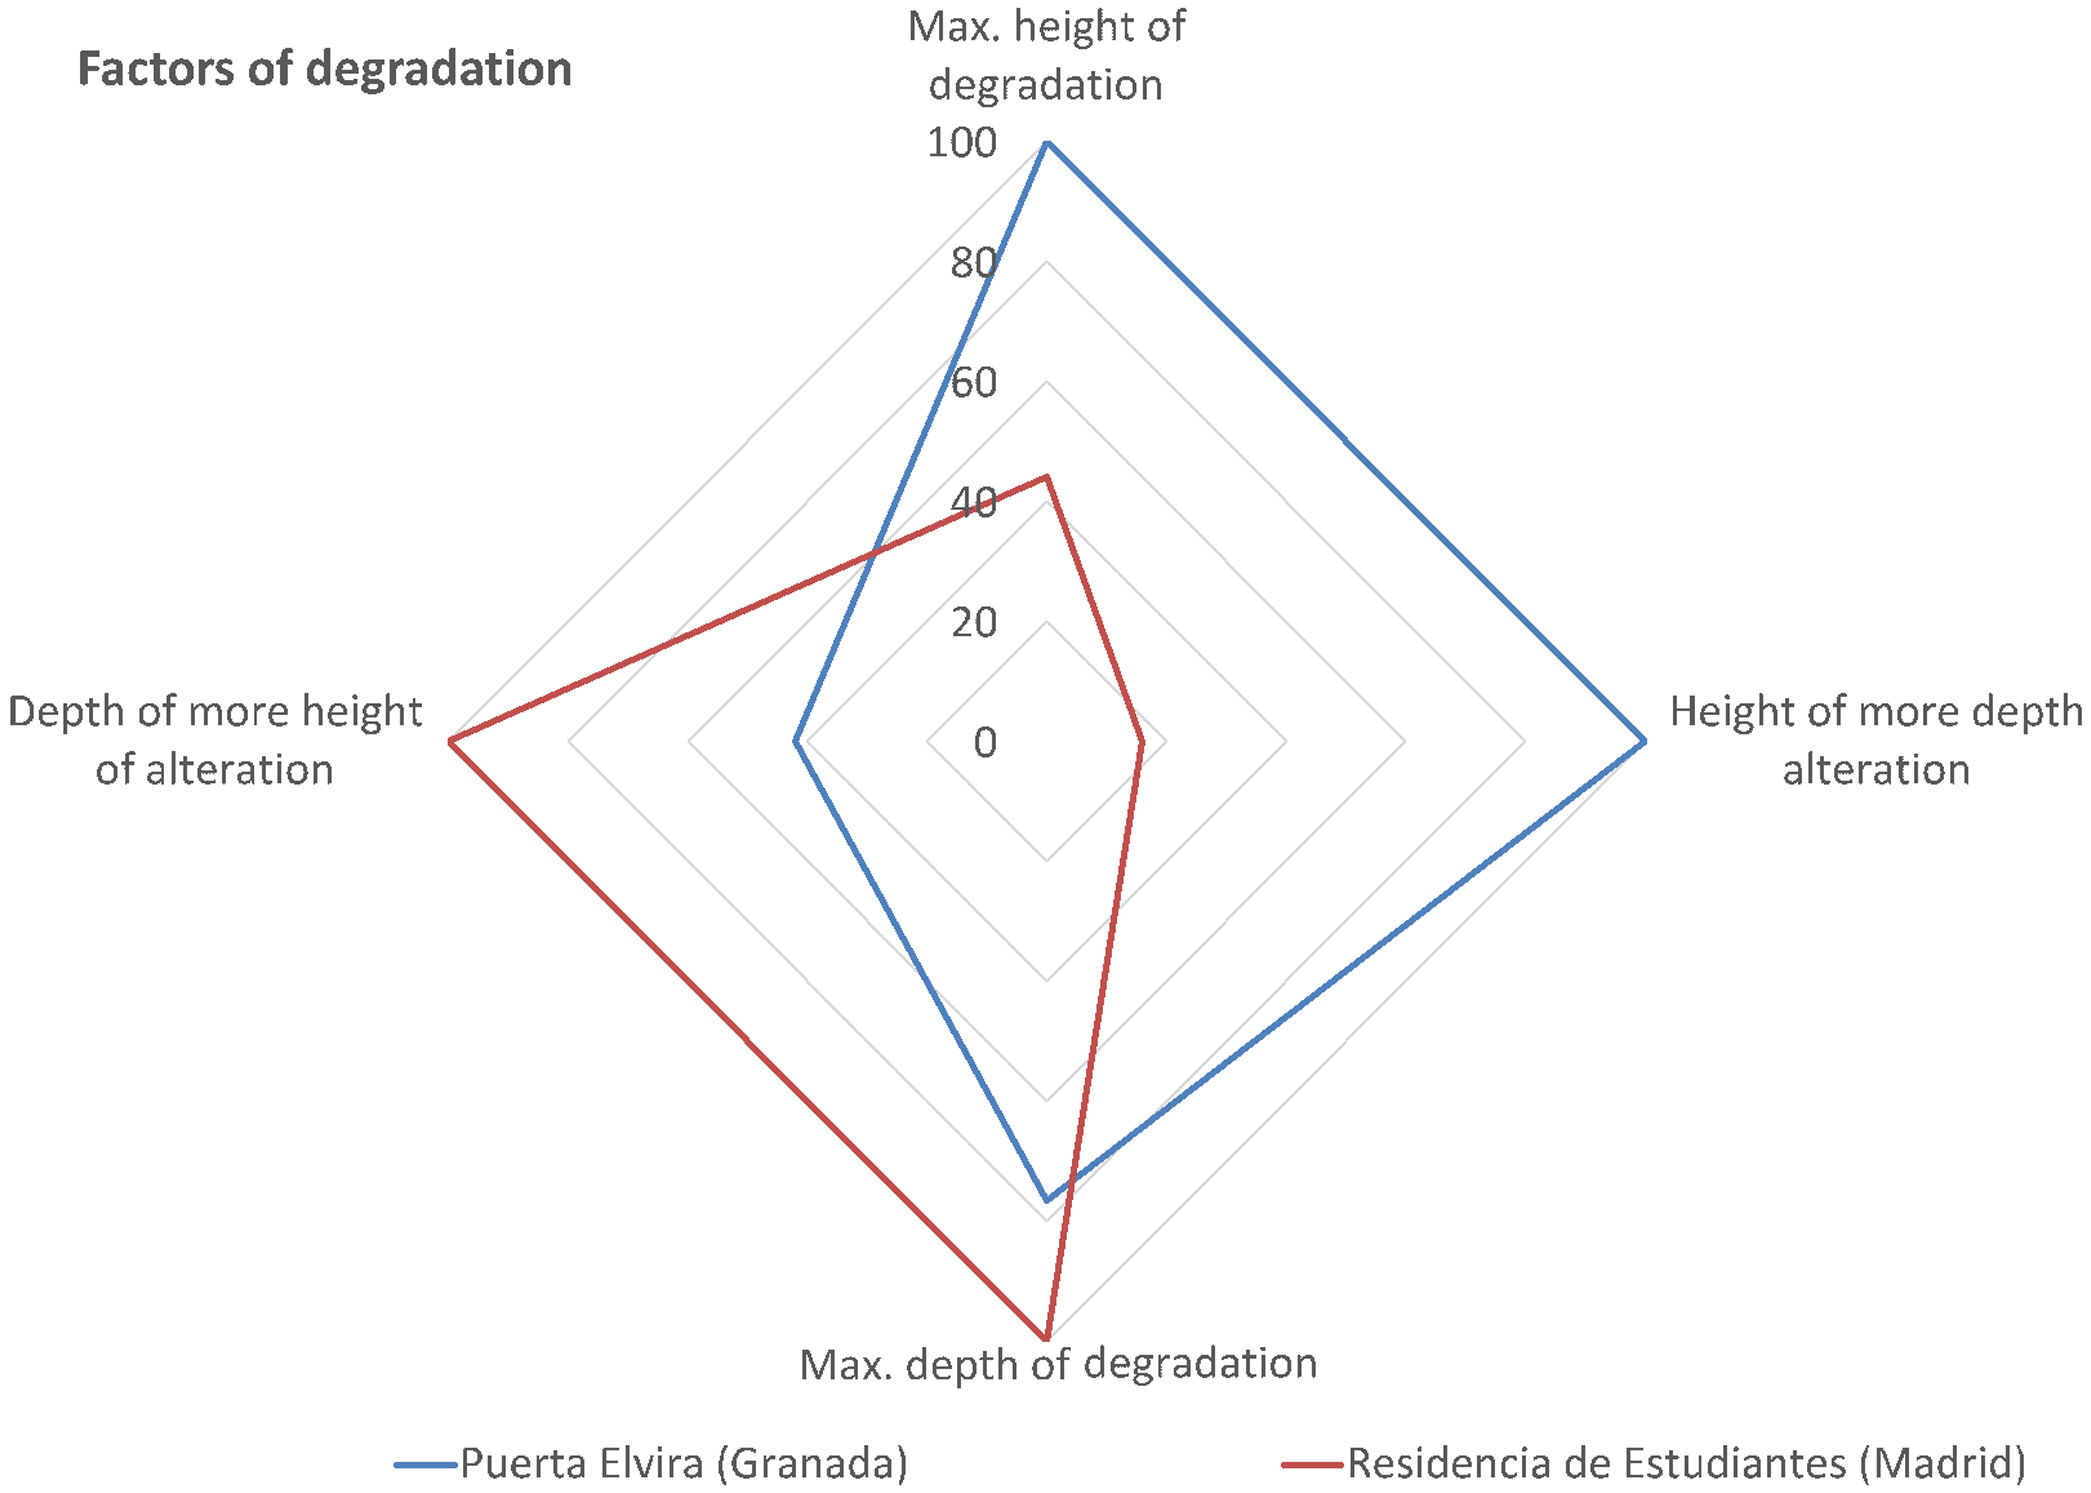
Degradation factors: Maximum degradation height, maximum degradation depth, height at which the greatest degradation depth occurs and depth at which the greatest degradation height occurs.
Table 9 contains a summary of the parameters measured, in group of factors, and their normalization to 100% with respect to the largest parameter. This normalization has been carried out in order to be able to represent each group of parameters comparatively.
Groups of factors associated with the rate of degradation of structures in height and thickness.
| Parameter type | Data | Normalized to 100% | |||
|---|---|---|---|---|---|
| Puerta Elvira (Granada) | Residencia de Estudiantes (Madrid) | Puerta Elvira (Granada) | Residencia de Estudiantes (Madrid) | ||
| Physico-chemical factors | Potentially soluble compounds | 5.48% | 7.20% | 76% | 100% |
| CO2 | 0.54% | 0.72% | 75% | 100% | |
| Soluble salts | 4.19% | 0.41% | 100% | 9.8% | |
| Open porosity | 29.51% | 36.99% | 79.8% | 100% | |
| Density | 2.95g/cm3 | 2.96g/cm3 | 99.6% | 100% | |
| Environmental factors | Maximum temperature | 39.7°C | 38.1°C | 100% | 95.9% |
| Minimum temperature | −5.6°C | −2.6°C | 100% | 46.2% | |
| Temperature variation | 56.8°C | 46.7°C | 100% | 82.2% | |
| Maximum wind gust | 108km/h | 96km/h | 100% | 88.9% | |
| Average rainfall | 667mm | 772mm | 86.4% | 100% | |
| Degradation factors | Maximum degradation heighta | 1.13m | 0.5m | 100% | 44.2% |
| Maximum degradation depth | 0.042m | 0.055m | 76.4% | 100% | |
| Height at which the greatest degradation depth occurs | 0.75m | 0.12m | 100% | 16% | |
| Depth at which the greatest degradation height occursb | 0.008m | 0.019m | 42% | 100% | |
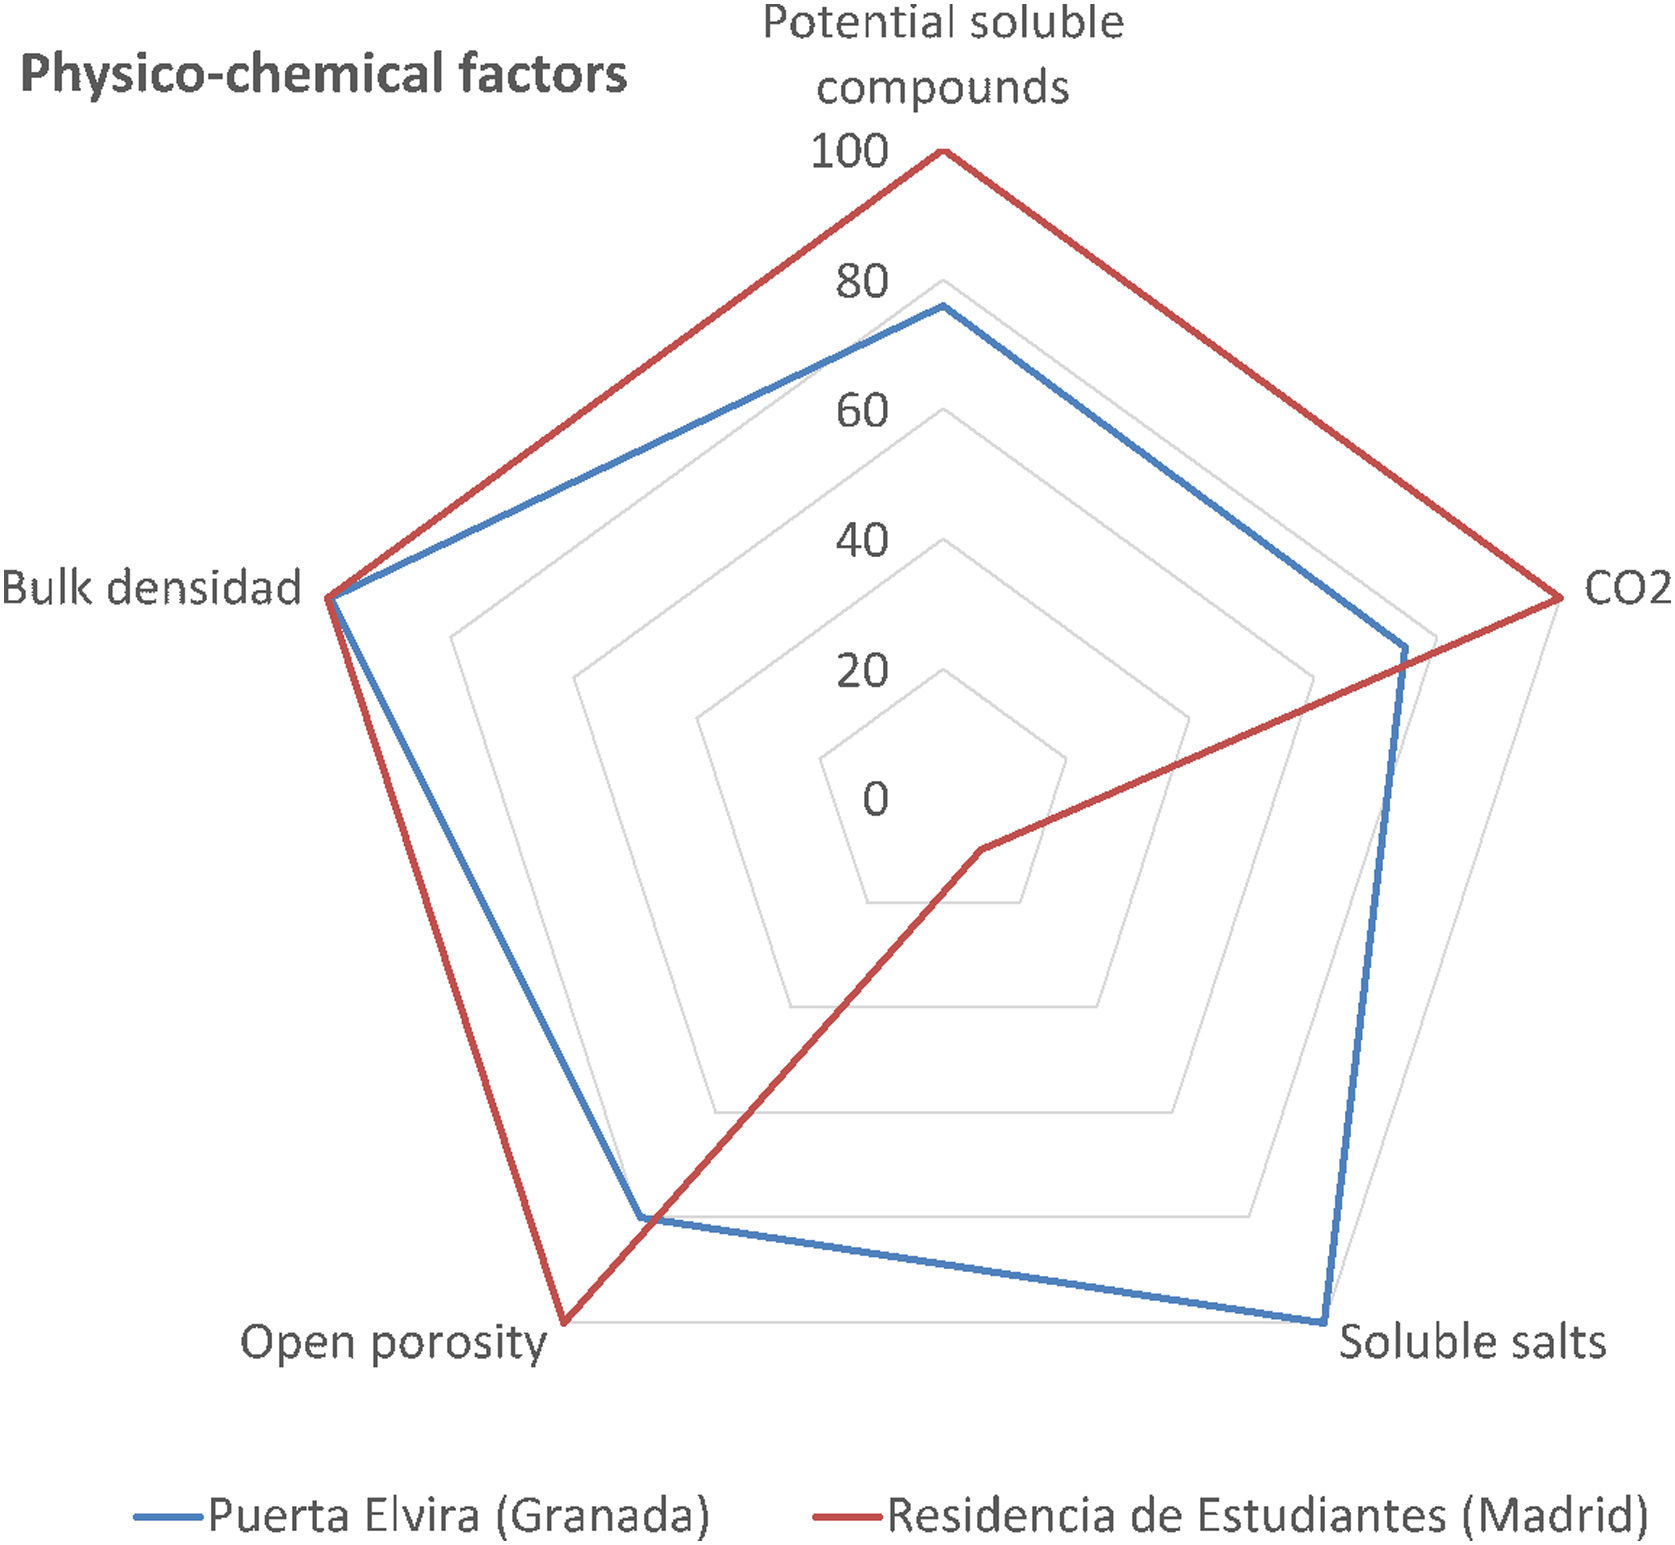
Figs. 11–13 show the relative influence of each parameter.


In Fig. 11, the physico-chemical factors are represented. It can be seen that the determining parameter in these factors are the soluble salts, while the rest of the parameters are quite similar. Table 4 indicates a much higher amount of both salts and alkalis leached in the samples from Puerta Elvira. This excess of alkali can produce efflorescence, which is responsible for the progressive deterioration of the bricks [36]. However, the wall of the Residencia de Estudiantes is located on a meadow, which a priori should be more aggressive. The explanation for these results is the use of de-icing salts at Puerta Elvira and the higher porosity of this brick compared with the bricks of the Residencia de Estudiantes.
Bricks and mortar can deteriorate from the salt-induced decay process caused by the internal pressures of salts on bricks, mainly through crystallization or hydration. Salts crystallize out of salt solutions existing in the pore spaces of bricks. Moreover, precipitated salts can result in pore blockage with the consequent reduction in wall permeability leading to water entrapment, which can lead to damage in later freeze–thaw cycles. However, as a result of salt hydration, there is a volume increase that leads to pressure being exerted on the brick matrix, which also may be a cause of the deterioration of the material [37,38]. The larger amount of salts at Puerta Elvira may come from de-icing salts. The presence of salts from the soil is ruled out given that Puerta Elvira is isolated from this by a pavement and there is no evidence of efflorescence in the bricks.
Regarding the chemical composition, the greater content of silica in the bricks at the Residencia de Estudiantes could be one reason for the low level of degradation, because the presence of silica prevents cracking and increases both hardness and durability. Moreover, the low lime content in the bricks at the Residencia de Estudiantes (near 1%) helps silica melt at a lower temperature and binds the particles of the brick together, leading to stronger bricks, while the excess of lime at Puerta Elvira is detrimental to the brick.
The level of insulation of the bricks from the ground is higher in the case of Puerta Elvira because there is a pavement between the brick walls and the ground. On the contrary, the bricks at the Pabellón Gemelo of the Residencia de Estudiantes are in contact with the soil. As a consequence, the moisture exposure by capillarity may be higher in the case of the Residencia de Estudiantes, which is favored by its higher porosity.
The higher amount of CO2 in the bricks from Puerta Elvira suggests that they were subjected to lower temperatures during their manufacture than the ones used at the Residencia de Estudiantes. This is usually the case with older bricks since lower temperatures were reached during firing, meaning less decarbonation. In addition, the higher amount of CO2 can allow the production of caliche, meaning flaking is more likely.
Fig. 12 shows the different environmental factors that have been obtained in this study. In general, all the weather conditions, except rainfall, are more unfavorable in Granada. It has been observed that the most significant factor in terms of differences between the two structures studied is the minimum temperature. Table 6 shows that the minimum temperatures in Granada are lower than in Madrid, which, despite having a continental climate with cold winters and hot summers, has higher minimum temperatures than Granada. In the case of Granada, these low winter temperatures are due to the proximity of the Sierra Nevada, with winds of greater intensity than in Madrid. The distance between the Sierra Nevada and Granada is 39.9km, while the distance between the Sierra de Navacerrada and Madrid is 62km.
Moreover, direct exposure is higher in PE because the trees and gardens surrounding the building of the Residencia de Estudiantes act as a barrier against the direct action of water and/or wind.
The effect of freezing while wet may be more significant in the Residencia de Estudiantes, given the higher porosity of the bricks and the fact that the shade effect of the surrounding vegetation makes drying more difficult. However, the cycles of moisture exposure (i.e. wetting and drying) are more pronounced at Puerta Elvira because it is not surrounded by buildings or vegetation.
Environmental pollution causes a layer of dirt on the surface of the bricks that can lead to the degradation of the wall. Puerta Elvira is located in the city while the Residencia de Estudiantes is in an area with restricted access, so anthropic pollution caused by the transit of vehicles and pedestrians is greater at Puerta Elvira [39].
The effect of freeze–thaw cycles and storms are similar at both Puerta Elvira and the Residencia de Estudiantes accounted for by the similar weather conditions in both cities. However, the greater exposure of Puerta Elvira, together with the wide thermal oscillation experienced every day in Granada make this effect more harmful at Puerta Elvira.
Another aspect to consider is the vandalism, which is worse at Puerta Elvira as the Residencia de Estudiantes complex has controlled access while Puerta Elvira is in the city center and in a public space.
Seismic events in Granada can provoke microcracks in bricks that, together with the above effects, can accelerate the deterioration process of Puerta Elvira. In fact, the samples from Puerta Elvira were bricks that had become detached during the recent seismic events in Granada.
In Fig. 13, the degradation factors have been represented. This figure clearly shows that Puerta Elvira is more degraded both in height and in surface. On the other hand, the Residencia de Estudiantes has greater degradation in depth than in height. This can be justified by the prairie soil at the Residencia de Estudiantes, which allows water access and freeze–thaw attack in winter, despite the bricks being less porous than those of Puerta Elvira.
As can be seen in Fig. 13, the effects of the degradation factors at Puerta Elvira and in the Residencia de Estudiantes are completely different from each other, but similar in terms of quantification. At Puerta Elvira, the influence of degradation on height is greater, while the greatest influence of degradation at the Residencia de Estudiantes corresponds to thickness.
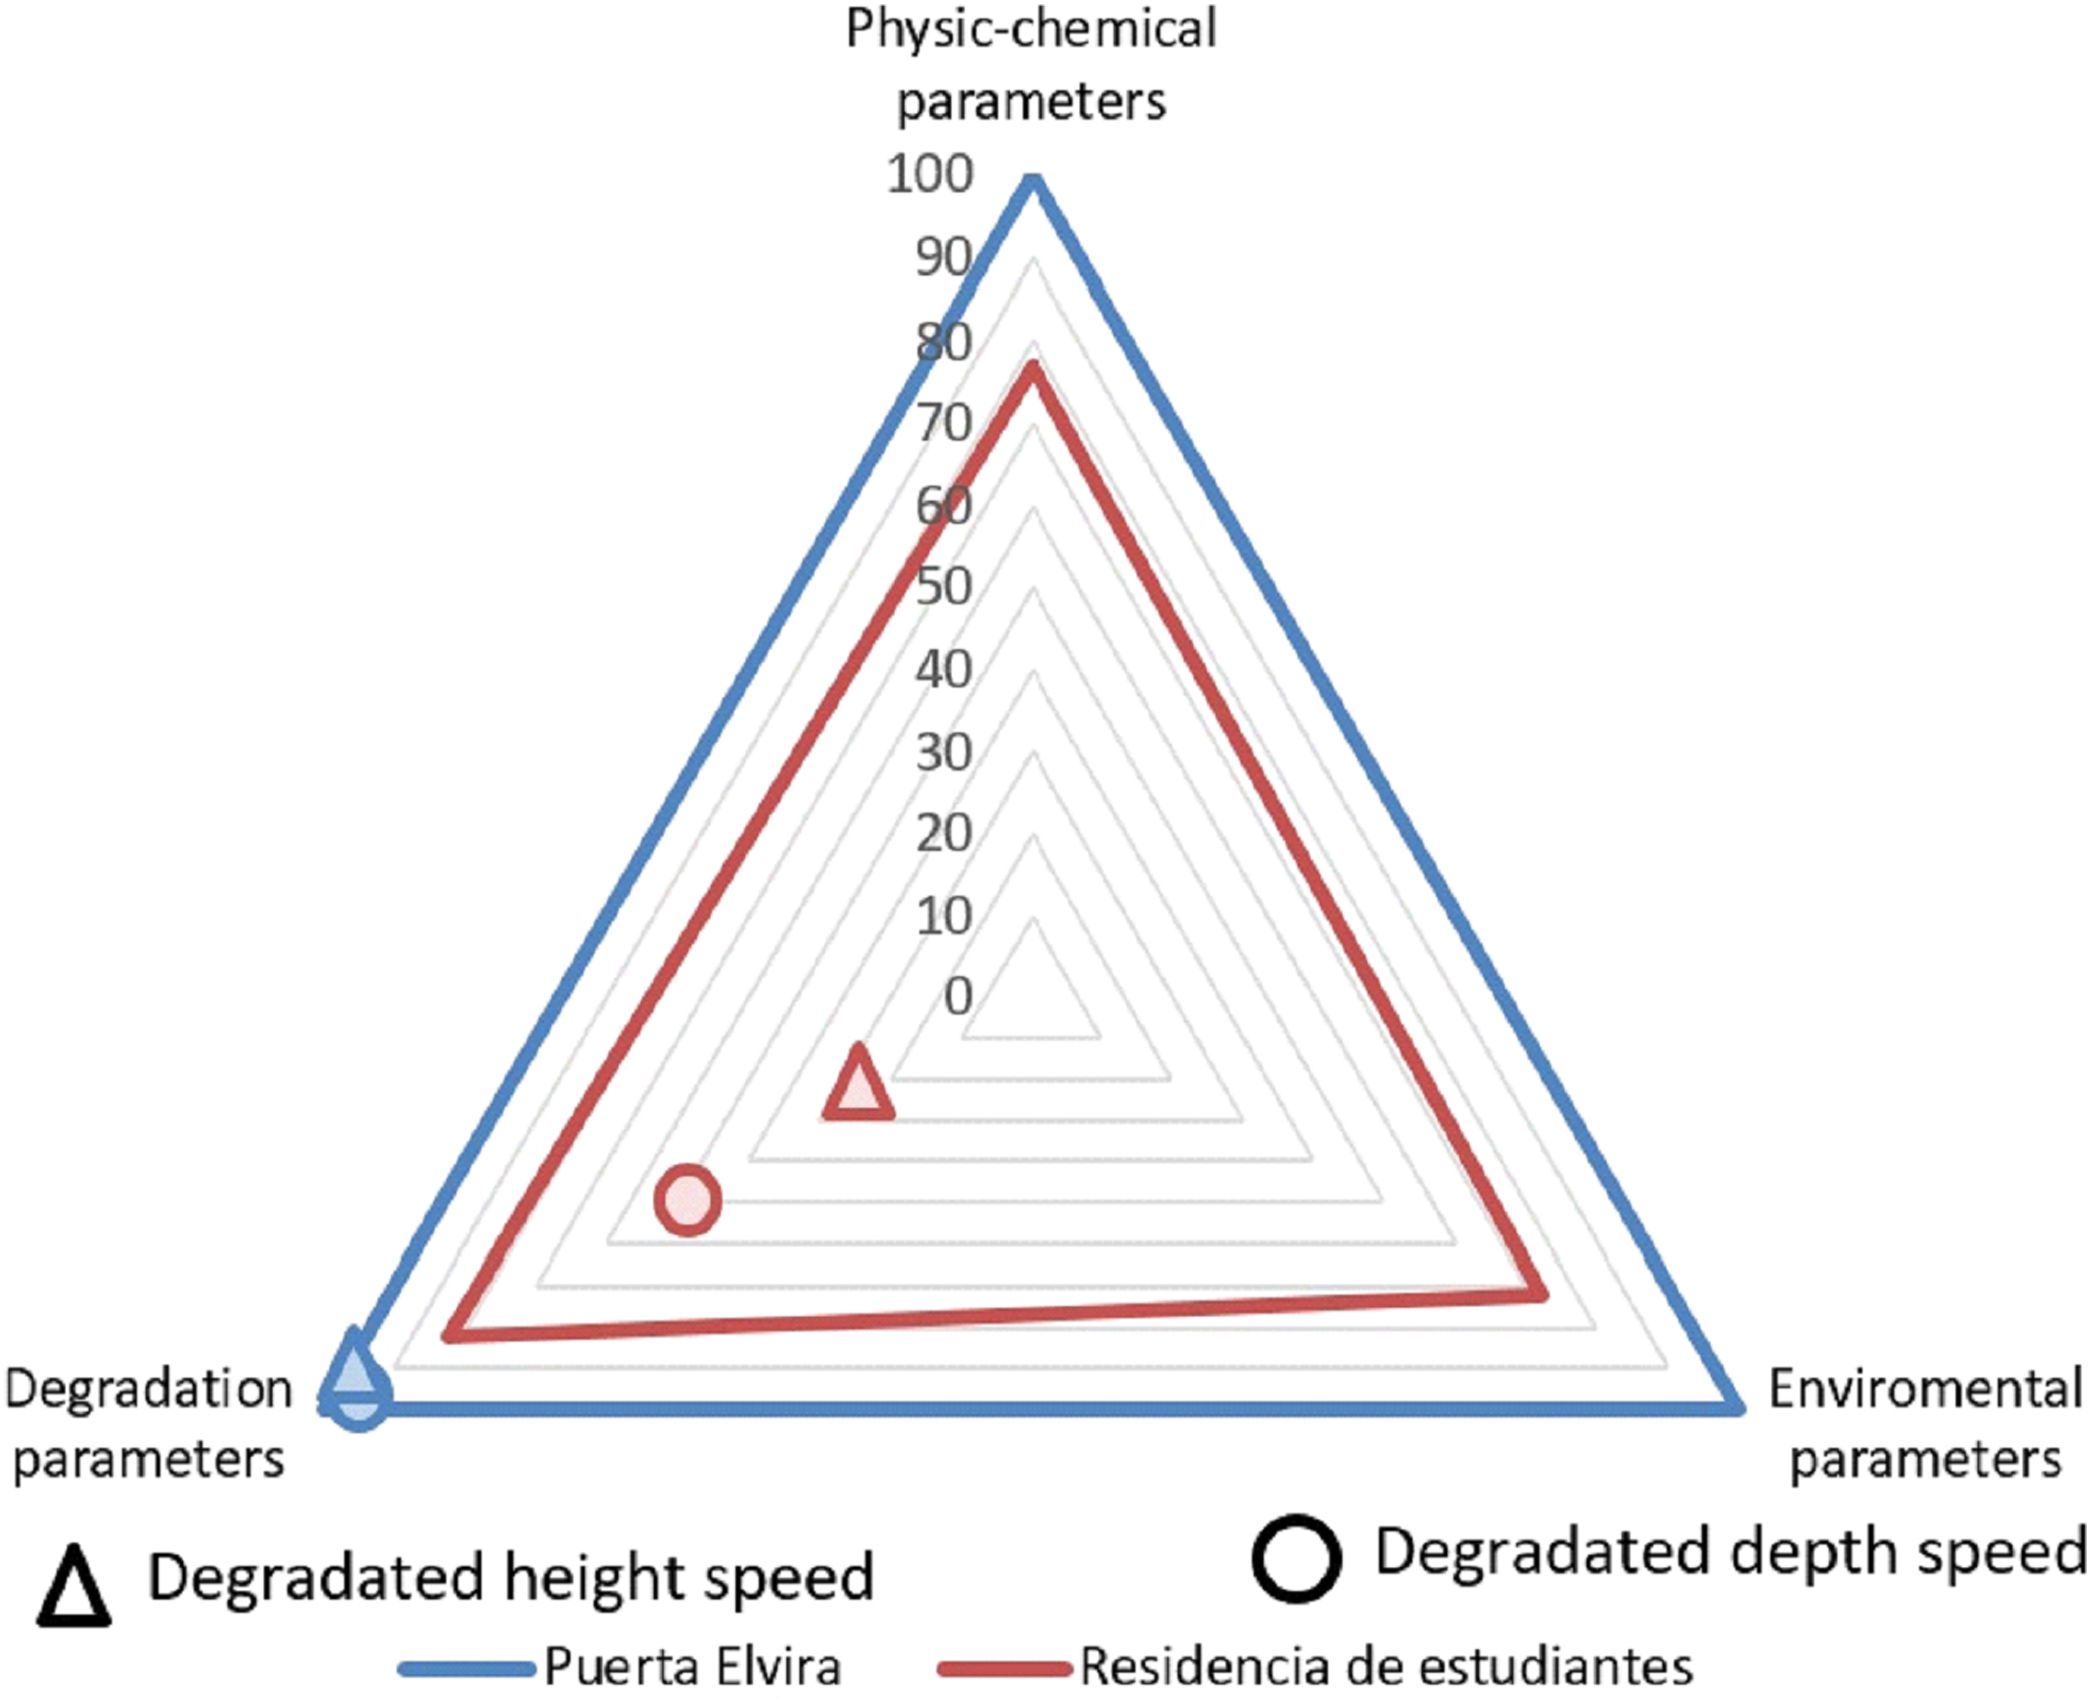
Finally, in Fig. 14, the weighted values of the three groups of factors (physico-chemical, environmental, and degradation) are represented. This weighting has been carried out by adding the relative weight of each parameter for each factor and normalizing it for each of the two structures studied. The representation includes each factor with its weighted values. In addition, the average relative speed of degradation in height (with triangles) and, the average relative speed of degradation in depth (with circles) for Puerta Elvira and the Residencia de Estudiantes have been represented. These degradation rates have been calculated by using surface recession patterns and the data taken from the geometrical 3D data analysis (Table 8).

Fig. 14 shows that the greater degradation in the physico-chemical, environmental, and degradation factors is shown at Puerta Elvira, while the Residencia de Estudiantes shows less degradation for the factors analyzed.
When the velocities of degradation in thickness (circles) and height (triangles) are represented in the axis of Degradation parameters, it can be observed that the results match with the experimental data measured in the laboratory, with the ones obtained by photogrammetry, and with those collected from the environmental records. The above conclusion validates the algorithms used in the analysis using surface recession patterns, which used the data taken from the geometrical 3D data analysis.
ConclusionsThe influence of several factors in the degradation of CH brick buildings has been analyzed. Two real cases have been studied: the Pabellón Gemelo of the Residencia de Estudiantes (Madrid) and Puerta Elvira (Granada). The results confirm that the most influential factors in the degradation of the bricks are environmental exposure, chemical composition, salts and alkalis leached, freeze–thaw cycles, moisture exposure, freezing while wet, and environmental pollution.
The experimental results from the structures analyzed show that the most significant differences are quantity of soluble salts and low environmental temperature, which lead to a higher degradation in depth at the Residencia de Estudiantes and to a higher degradation in height at Puerta Elvira.
The results show that reliable surface of regression or degradation patterns can be characterized by using a Bayesian methodology based on non-sophisticated digital photogrammetry. The methodology allows for several sources of uncertainty to be accounted for. The latter is especially practical for carrying out future extrapolations about degradation effects over time assuming a constant degradation rate in CH brick facades.
The representation of the groups of parameters: physic-chemical, environmental and degradation has shown the coherence of the results with the experimental ones measured in the laboratory, with data from photogrammetry and with those collected from the environmental data. The above validates the algorithms used in the analysis using surface recession patterns by using the data taken from the geometrical 3D data analysis.
Finally, the model of speed degradation based on surface recession patterns with the data taken from the geometrical 3D data analysis has been corroborated by the experimental results obtained from analyzing the bricks and the environmental exposure conditions of the structures.
FundingThis work was supported by the Spanish Government (Ministerio de Ciencia, Innovación y Universidades) as part of the Research Projects RTI2018-101841-B-C21 and RTI2018-101841-B-C22 (MINECO/FEDER).
The authors want to thank the CSIC Residencia de Estudiantes for allowing access to take photographic data and samples of the deteriorated bricks (fallen on the meadow) of the Pabellón Gemelo. The authors also want to thank Hairon Recino and Esther Puerto for carrying out part of the experimental and data treatment work, hired through the CSIC project PIE 202060E176.
Historical weather data in Granada and Madrid are shown below in Tables A1 and A2, respectively. The climatological parameters summarized in the columns from left to right are: absolute maximum and minimum temperatures in degrees centigrade, absolute maximum gust in km/h, and average pluviosity in mm. The climatological data from the last 40 years are summarized below.
Climatological data from Granada. Airport station.
| Year | TMab (°C) | Tmab (°C) | Taverage (°C) | Absolute maximum gust (km/h) | Total pluviosity (mm) |
|---|---|---|---|---|---|
| 1980 | 40 | −8.4 | 15.8 | 92.16 | 279.17 |
| 1981 | 39.8 | −8.4 | 15.7 | 83.88 | 226.30 |
| 1982 | 40.4 | −3.2 | 18.6 | 99 | 299.98 |
| 1983 | 36.6 | −7.4 | 14.6 | 64.08 | 280.13 |
| 1984 | 39.6 | −8.2 | 15.7 | 66.96 | 286.50 |
| 1985 | 40.2 | −9.8 | 15.2 | 78.84 | 283.23 |
| 1986 | 40 | −5 | 17.5 | 65.16 | 422.90 |
| 1987 | 39.6 | −14.2 | 12.7 | 92.88 | 418.86 |
| 1988 | 41.6 | −5 | 18.3 | 69.84 | 295.42 |
| 1989 | 40.4 | −6.2 | 17.1 | 90 | 480.05 |
| 1990 | 36.6 | −4.6 | 16 | 86.04 | 356.64 |
| 1991 | 38.6 | −5 | 16.8 | 87.12 | 282.95 |
| 1992 | 38 | −8.6 | 14.7 | 75.96 | 311.69 |
| 1993 | 40.6 | −7 | 16.8 | 66.96 | 251.24 |
| 1994 | 41.6 | −8.4 | 16.6 | 83.16 | 235.24 |
| 1995 | 42.6 | −7 | 17.8 | 65.88 | 217.19 |
| 1996 | 39 | −4.4 | 17.3 | 74.88 | 667.53 |
| 1997 | 38 | −0.6 | 18.7 | 99.96 | 604.03 |
| 1998 | 39 | −4.7 | 17.15 | 75.96 | 184.46 |
| 1999 | 39.8 | −4 | 17.9 | 101.88 | 281.93 |
| 2000 | 40.6 | −5.8 | 17.4 | 68.04 | 441.70 |
| 2001 | 39.6 | −2.4 | 18.6 | 100.08 | 435.07 |
| 2002 | 37 | −2.2 | 17.4 | 60.84 | (*) |
| 2003 | 40 | −5 | 17.5 | 70.92 | 384.79 |
| 2004 | 40.8 | −4.5 | 18.15 | 65.16 | 282.97 |
| 2005 | 40.3 | −10.9 | 14.7 | 65.16 | (*) |
| 2006 | 42 | −4.7 | 18.65 | 66.96 | 333.50 |
| 2007 | 39.6 | −6.9 | 16.35 | 78.12 | 211.09 |
| 2008 | 39.2 | −4.1 | 17.55 | 79.92 | 352.03 |
| 2009 | 36.6 | −4.1 | 16.25 | 91.08 | 502.38 |
| 2010 | 37.2 | −5 | 16.1 | 70.92 | 565.12 |
| 2011 | 39.8 | −3.8 | 18 | 75.96 | 368.82 |
| 2012 | 40.2 | −4 | 18.1 | 72 | 407.14 |
| 2013 | 38.2 | −3.5 | 17.35 | 68.04 | 492.75 |
| 2014 | 38.8 | −2.3 | 18.25 | 68.04 | 384.29 |
| 2015 | 41.3 | −7 | 17.15 | 78.12 | 245.63 |
| 2016 | 40.8 | −3.4 | 18.7 | 83.88 | 295.11 |
| 2017 | 41.8 | −4.7 | 18.55 | 95.04 | (*) |
| 2018 | 41.3 | −3.3 | 19 | 108 | (*) |
| 2019 | 40.7 | −6 | 17.35 | 68.04 | (*) |
| 2020 | 40.4 | −5.2 | 17.6 | 72 | 311.14 |
| Average | 39.74 | −5.68 | 15.87 | 79.66 | 362.46 |
(*) No data registered.
Climatological data from Madrid. Retiro station.
| Year | TMab (°C) | Tmab (°C) | Taverage (°C) | Absolute maximum gust (km/h) | Total pluviosity (mm) |
|---|---|---|---|---|---|
| 1980 | 37 | −4.4 | 16.3 | 86.04 | 309.89 |
| 1981 | 38 | −1.8 | 18.1 | 96.84 | 345.93 |
| 1982 | 38 | −1 | 18.5 | 68.04 | 442.71 |
| 1983 | 36.4 | −6.5 | 14.95 | 72 | 192.30 |
| 1984 | 37.4 | −3.4 | 17 | 74.16 | 501.15 |
| 1985 | 37.6 | −7.4 | 15.1 | 90 | 294.12 |
| 1986 | 37.5 | −3.2 | 17.15 | 74.88 | 606.79 |
| 1987 | 39 | −4.3 | 17.35 | 72 | 454.41 |
| 1988 | 37 | −2.1 | 17.45 | 78.84 | 468.58 |
| 1989 | 37.2 | −1 | 18.1 | 92.16 | 772.40 |
| 1990 | 37 | −2 | 17.5 | 65.16 | 245.65 |
| 1991 | 39.4 | 14.3 | 26.85 | 78.84 | 387.88 |
| 1992 | 37.9 | −2.5 | 17.7 | 75.96 | 395.49 |
| 1993 | 40 | −3.8 | 18.1 | 83.16 | 341.67 |
| 1994 | 38 | −3.4 | 17.3 | 78.84 | 276.35 |
| 1995 | 39.5 | −1.8 | 18.85 | 68.04 | 559.80 |
| 1996 | 37 | −3 | 17 | 74.16 | 511.34 |
| 1997 | 36.5 | −1.6 | 17.45 | 72 | 513.15 |
| 1998 | 36.5 | −2 | 17.25 | 77.04 | 430.33 |
| 1999 | 37.3 | −3.4 | 16.95 | 72 | 253.21 |
| 2000 | 36.4 | −2 | 17.2 | 78.12 | 393.93 |
| 2001 | 36.4 | −5.5 | 15.45 | 69.12 | 309.11 |
| 2002 | 36.3 | 0 | 18.15 | 69.12 | 424.67 |
| 2003 | 38.6 | −3.6 | 17.5 | 83.16 | 465.35 |
| 2004 | 38.4 | −2.6 | 17.9 | 68.04 | 413.99 |
| 2005 | 38 | −6.1 | 15.95 | 79.92 | 343.91 |
| 2006 | 37.6 | −2.8 | 17.4 | 78.12 | 484.90 |
| 2007 | 36.9 | −2.2 | 17.35 | 74.16 | 289.55 |
| 2008 | 38 | −3 | 17.5 | 82.08 | 424.17 |
| 2009 | 38.4 | −5 | 16.7 | 79.92 | 307.83 |
| 2010 | 37.4 | −3.8 | 16.8 | 87.12 | 212.31 |
| 2011 | 38.3 | −3.4 | 17.45 | 78.12 | 269.99 |
| 2012 | 40.6 | −3.6 | 18.5 | 74.16 | 420.62 |
| 2013 | 37.2 | −1.4 | 17.9 | 88.92 | 303.51 |
| 2014 | 37.2 | −1.9 | 17.65 | 82.08 | 496.54 |
| 2015 | 39.6 | −1.7 | 18.95 | 96.12 | 268.72 |
| 2016 | 38.6 | −2.5 | 18.05 | 82.08 | 509.48 |
| 2017 | 39.2 | −3 | 18.1 | 74.16 | 334.77 |
| 2018 | 39.9 | −0.3 | 19.8 | 95.04 | 422.14 |
| 2019 | 38 | −1.8 | 18.1 | 78.12 | 309.89 |
| 2020 | 39.4 | −1.3 | 19.05 | 87.12 | 345.93 |
| Average | 37.92 | −2.48 | 17.72 | 78.90 | 391.57 |

