
Abstract
Over the last decades, the estimation of the slack in the economy has become an essential piece of analysis for policymakers, both on the monetary policy and the fiscal policy front. Output gap estimation techniques have flourished accordingly, although there is no consensus on a best-performing methodology, as the selection criteria often imply important trade-offs. This paper presents a novel approach putting the focus on the specification of the model rather than on a prior selection of the methodology itself. Ideally, an agreeable method should achieve three necessary conditions: economic soundness, statistical goodness and transparency. On top of this, consistency with the business cycle narrative, as often implemented by policymakers, is also a critical condition. In practice, fulfilling these conditions can prove to be challenging. The main issues in practice are related to the specification of the model, the selection of the relevant variables, the stability and uncertainty of the estimates and its use on a real-time basis. This paper presents a methodological approach based on a structural multivariate time series model and Kalman filtering. The method fulfils the necessary criteria and allows for enough flexibility in order to get a country-specific approximation to the sufficient criterion as it could accommodate specific cycles (financial, external, investment, fiscal, etc.). The method is put to the test with an illustration for the Spanish economy, assessing its merits as well as its limitations.
1 Introduction
Policymakers strive to understand the dynamics of the business cycle and pinpoint its specific location as it decisively determines the outcome of policy decisions. The slack or output gap, defined as the amount of unemployed resources (i.e. the distance to potential output) is, however, not observable and surrounded by considerable uncertainty.
The literature has developed a myriad of estimation techniques over the last decades, ranging from data-driven univariate filters to structural general equilibrium models.Footnote 1 The horse race in search of an optimal output gap estimation methodology seems far from settled. On the one hand, the uncertainty surrounding the output gap estimates has proven a challenging task, leading to unreliable estimates in real time, which happens to be the policy-relevant time frame. On the other hand, confronting output gap estimates with optimality criteria (both statistical and economic ones) has generally led to inconclusive results, as the former might be ill-defined or even incompatible and thus a selection algorithm becomes necessary.
The selection criteria should aim at providing a well-defined metric or comparable benchmark for different estimates. In practice, they can generally be split into three dimensions. First, statistical goodness (SG) referring to elements such as minimizing the end-point problem or providing information on the precision of the estimates. Second, economic soundness (ES) implying ex-ante consistency between selected stylized facts and the method’s underlying assumptions. And third, transparency (TR) requirements as seen from a user-specific perspective, reflecting accountability elements such as likelihood of replication or data needs.
These three criteria might be considered as a necessary methodological prerequisite. Figure 1 reflects potential tensions in their fulfillment and represents trade-offs faced by some standard methodologies (DSGE models, univariate filters and the production function approach). The internal optimality area represents methods satisfying the necessary conditions (although in different degrees). They are not, however, sufficient conditions as ultimately the acceptance of a specific output gap estimate must pass the smell test or narrative approach, providing an acceptable country-specific narrative that explains the cyclical evolution.

Optimality necessary requirements
This paper builds upon existing research on output gap measurement techniques and presents an approach for the selection of an output gap estimate that pivots around a multivariate unobserved components (MUC) Kalman filter estimation. Multivariate filters and the unobserved components multivariate Kalman filter technique represent a good compromise between the necessary criteria, falling within the optimality area in Fig. 1. First, the use of a multivariate framework allows for the consideration of additional economic relationships (Okun's Law, Phillips Curve, etc.) going beyond univariate filters while at the same time imposing lighter economic priors than fully structural models and thus sticking more closely to the data. Second, the statistical properties of multivariate techniques clearly outperform other methods such as the production function approach, allowing for example for an integrated estimation of uncertainty. Third, multivariate approaches are generally not data-intensive and thus easily replicable and largely transparent, being more parsimonious than fully-fledged economic models.Footnote 2
The focus for the selection of a specific output gap estimate is diverted from the traditional model horse race, which focuses on the comparison between different methodologies along the three necessary criteria (ES, SG and TR). Instead, the final estimate is derived from a beauty contest between candidate variables in a MUC framework. Different specifications of the model are tested by combining GDP with potential candidate variables sharing relevant information about the business cycle. The latter can include domestic (capacity utilization, unemployment), open-economy (current account, exchange rate), financial (credit to non-financial corporations) and price (GDP deflator, CPI, house prices) candidates. The selected approach allows for country-specific cycle definitions, generalizing the work in Borio et al. (2017) and Alberola et al. (2013).
The paper is structured as follows; Sect. 2 details the estimation methodology, Sect. 3 specifies the necessary and sufficient criteria and develops the selection algorithm, Sect. 4 present an application for Spain as a case study and Sect. 5 concludes. Finally, two appendices complete this contribution, the first one devoted to the implementation of the Kalman filter and, the second one, giving details on the statistical features of the selected output gap estimate for Spain.
2 Econometric methodology
This section develops the econometric approach used to estimate the output gap as well as the associated cyclical (or transitory) components. This section has two parts. The first one is devoted to the presentation of the multivariate model used to estimate the output gap and the second one to its estimation by means of the Kalman filter.
The econometric approach is based on the well-known Structural Time Series (STS) representation of a time series vector, see Clark (1987), Harvey (1989), Kuttner (1994), Kitagawa and Gersch (1996), Kim and Nelson (1999) and Durbin and Koopman (2001), among others. This method is rather general and flexible albeit keeping the number of parameters tightly controlled, in contrast with other econometric approaches (e.g. Vector of autoregressions, VAR).
2.1 The structural multivariate time series model
The structural decomposition provides an efficient way to estimate the output gap or, more generally, to decompose an observed time series as the sum of an arbitrary number of unobserved elements.
As a starting point, the (log-transformed) observed real Gross Domestic Product (GDP) can be decomposed as the sum of a non-stationary component and a stationary cycle as in (1). The trend follows a random-walk plus time-varying drift, which is also stochastic and follows a random walk (see Eqs. 2, 3). The cyclical dynamics is characterized by means of a second-order autoregressive process whose roots lie outside the unit circle (Eq. 4).
Combining Eqs. (1)–(4) the reduced-form MA model for yt is given by:
Note that, in general, the structural model imposes an I(2) representation for the trend although, depending on the values of the variances of the shocks, this representation can collapse into an I(1) trend (with or without deterministic drift) or a linear trend plus noise. In this way, the model provides a flexible and parsimonious way to represent different non-stationary dynamics.Footnote 3
Finally, the three shocks that drive the system are assumed to be orthogonal Gaussian white noise innovations:
The assumption of orthogonality can be relaxed at the cost of making shock identification more difficult, see Clark (1987) for an in-depth analysis. For example, to represent hysteresis the shocks that determine the long-term trend would need to be correlated with those that drive its short-term rate of growth, replacing (6) by a non-diagonal matrix:
In the remaining of the paper complete orthogonality among the shocks is assumed.
The model for the GDP, see Eqs. (1)–(4), can be extended just by including additional variables whose stationary component is related to the output gap. This extension allows for the introduction of relevant macroeconomic stylized facts (as the Okun’s Law, the Phillips Curve, etc.).
In this way, their observed values, properly filtered, provide additional information to estimate the output gap. The trend of the additional variables can be I(2) or I(1). For the sake of simplicity, let us consider two additional variables, one with an I(2) trend and the other with an I(1) trend.
The structural representation of the I(1) or I(2) variable is given by (14) or (15), respectively.
The transition equation for the extended model, together with its corresponding measurement counterpart are given by Eqs. (10) and (11).
Both equations represent the structural time series model in a compact and form. The notation \( F\left( \phi \right) \) and \( H\left( \alpha \right) \) emphasizes the allocation of dynamical parameters (\( \phi \)) and static parameters (\( \alpha \)) in the transition equation and the measurement equation, respectively. The variance–covariance (VCV) matrices of the extended model are given by (13). The parameters of the model can be put together in a single vector, as in (14).
2.2 Kalman filtering
Given some initial conditions for the state vector S0 and assuming that the vector ϴ is known, the Kalman filter can be used to estimate the state vector and its corresponding standard error. In practice, the vector ϴ is not known and must be estimated from the sample. Fortunately, the state space format and the Kalman filter provide a feasible way to evaluate the likelihood function and, using numerical methods, to maximize it.
Once the ϴ parameters have been estimated, the Kalman filter is run to derive new initial conditions by means of backcasting (i.e., forecasting observations prior to the first observation). This process of backcasting can be done just by projecting forward the model using the reversed time series. In this way, a new set of initial conditions exerting a limited influence on the estimation of the state vector is derived by means of the Kalman filter. The complete algorithm can be stated as follows.
-
Initialization 1 Set initial parameters: ϴ0.
-
Initialization 2 Set initial conditions: S00. Initial conditions for the state vector are provided using a diffuse prior centered on zero with an arbitrarily large VCV matrix.
-
Likelihood computation Conditioned on the initial parameters and the initial conditions, we run the Kalman filter to compute the likelihood, see “Appendix A” for the detailed implementation of the Kalman filter algorithm.
-
Likelihood maximization The maximum likelihood estimation (MLE) is implemented numerically via the fminuncFootnote 4 function from the Matlab optimization toolbox. The definition of the objective function incorporates the constraints that ensure the non-negativity of the variances and the stationary nature of the AR(2) parameters.
-
Reinitialization The use of diffuse initial conditions to run the Kalman filtering is a simple device to start its algorithm but may generate some sensitivity in the estimates of the state vector. To desensitize these estimates, we generate backcastsFootnote 5 (e.g. forecasts of observations prior to the first observation). This process of backcasting is done just by projecting forward the model using the reversed time series. In this way, we obtain a new set of initial conditions S01 that exerts a limited influence on the estimation of the state vector as derived by means of the Kalman filter.
-
One-sided (concurrent) estimates of the state vector The one-sided (or concurrent) estimates of the state vector are obtained running recursively the Kalman filter from t = 1 to t = T (forward in time). This estimate considers only the information available from t = 1 to t = h to estimate the state vector at time t = h and is very useful to analyze the state of the system on a real-time basis. See “Appendix A” for a detailed exposition.
-
Two-sided (historical, smoothed) estimates of the state vector In addition, the two-sided (or historical) estimates of the state vector are obtained running recursively the Kalman filter from t = T to t = 1 (backward in time), using as initial conditions the terminal concurrent estimates obtained in the previous step. This process considers all the information available from t = 1 to t = T to estimate the state vector at any time t = h, 1 ≤ h≤T. The smoothing algorithm is formalized in “Appendix A”.
From an econometric view, one-sided and two-sided estimates play a complementary role. The first one serves as the starting point for the second and provides a benchmark to quantify the additional precision that the full sample introduces. Note that two-sided estimates are more precise because they incorporate all the available information from t = 1 up to time t = T to estimate the state vector in any intermediate point and, due to their symmetric nature. Note that this symmetry is due to the fact that the filter runs backward from estimates derived forward. In this way, two-sided filtering does not introduce any form of phase-shift in the estimates.
However, this estimate is not useful for real-time analysis since it incorporates information not available a t = h to evaluate the state of the system at that time and hence introduces some form of hindsight bias. This is particularly important when dealing with output gap estimation because its main use is related to the assessment of the fiscal policy stance. In practice, fiscal policy at time t is primarily determined using only information available up to time tFootnote 6 and this explains the preeminence that we will attach to one-sided estimates in the empirical application.
Of course, this preeminence does not imply that two-sided estimates are irrelevant. Quite the contrary, they serve to produce useful measures of uncertainty and to gauge the impact of the full sample on the estimates of the output gap, especially around the turning points.
3 Selection criteria
As mentioned before, the potential output of the economy cannot be measured directly, consequently there is no observable target or benchmark for comparison. This makes it difficult to evaluate alternative specifications.Footnote 7
To operationalize the optimality requirements specified previously, this section defines a set of criteria covering the relevant dimensions against which to gauge the different estimates. These criteria are split into two categories. First, the statistical-based ones define the necessary conditions. Second, the more economically and policy-oriented ones, underline the sufficient conditions.
Group 1, necessary conditions:
-
Criterion 1 Statistical significance of the coefficients, focusing on the loadings of the observables on the cycle;
-
Criterion 2 Average relative revision, defined as the average distance between one-sided and two-sided estimates, relative to the maximum amplitude of the output gap estimate;
-
Criterion 3 Average relative uncertainty surrounding the cycle estimates, as the average standard error relative to the maximum amplitude.
As we have already noted, output gap estimation is a (fiscal) policy-oriented exercise that is implemented through econometric procedures. In this way, for good and for bad, the results must be considered taking into account its usefulness for policy-makers and fiscal monitoring. Revisions play an important role in the assessment of the results. From a statistical view, revisions are the price that we pay to have the most reliable and updated output gap estimates. On the other hand, policy-makers and supervisors tend to view revisions as a nuisance that complicates decision making and the implementation of fiscal rules.
For the same reasons, being other things equal, the more precise the estimates (i.e. the lower its standard error), the better because in this way the policy assessment can be made in a more precise way. These are the rationale for criteria 2 and 3.
Group 2, sufficient conditions:
-
Criterion 4 Economic soundness, meaning that some key macroeconomic relationships could be captured by variables if included in the model (e.g. Okun’s Law, Phillips Curve, etc.);
-
Criterion 5 Amplitude and profile alignment with consensus figures (range given by a panel of official institutions) and in agreement with commonly accepted business cycle chronology (e.g. ECRI dating). The quantification of the profile alignment can be made by means of the cross-correlation function and different measures of conformity, e.g. Harding and Pagan (2006)Footnote 8;
-
Criterion 6 Stability of the one-sided cycle estimate, as this would mimic the practitioner’s need for updated estimates as new data is added in real time.Footnote 9 Stability can be measured using the revisions of the one-sided estimates.
Criterion 5 deserves an additional explanation. Since output gap measurement is made for policy-making and policy assessment, agreement with the profile of official estimates is a plus when comparing among alternative estimates. Of course, synchronicity (i.e., turning point coincidence) is more important than an exact match between the magnitude of the output gap estimates.
4 Let the data speak: an application to Spain
The Spanish economy presents an interesting case study to put the methodology to the test. According to traditional visions of the cycle, such as the Phillips curve, the run up to the 2008 financial crisis was not perceived as an overheating period. Unemployment developments since the trough in 1994 to the peak in 2007 (from 24 to 8%) were not mirrored by rising inflationary pressures (see Fig. 2a). These gains were thus interpreted as structural and real-time estimates of the non-accelerating inflation rate of unemployment (NAIRU) moved in line with observed data.

Source: National Statistical Institute, Bank of Spain
Spanish accumulation of imbalances in the upswing. a Phillips curve, b external imbalances, c external imbalances.
With hindsight, this vision was clearly misguided, By the early 2000s, Spain was already accumulating large imbalances and heating pressures were present although not visible in headline inflation figures. For example, as can be seen in panels b in Fig. 2, the current account was leaking. Extending the concept of structural unemployment from the NAIRU to include a balanced external sectorFootnote 10 already reveals a downward bias in the former as it did not take into account all the relevant dimensions. Why stop there? Other variables might have also been relevant in defining and identifying the Spanish cycle, such as investment in construction, which was soaring (see Fig. 2c) together with prices in non-financial assets (mainly dwellings).
By letting the beauty contest between the different candidate variables take place, the methodology developed in previous sections provides an efficient algorithm for variable selection. Previous attempts at describing the Spanish cycle with a similar methodology can be found in Doménech and Gómez (2006), Doménech et al. (2007) and Estrada et al. (2004). In particular, our approach is affine to the first one.Footnote 11
4.1 Data set and data processing
The selection of potential candidate variables follows an encompassing approach, aiming at capturing the build-up of potential imbalances across all relevant dimensions: (i) domestic economy; (ii) external sector; (iii) prices; (iv) labour market, and (v) financial and monetary conditions, as it can be seen in Table 1. This set of indicators is easily replicable for different countries and, at the same time, encompassing enough to reflect a great variety of economic cycles.
In relation to data processing, all the variables must be corrected from seasonal and calendar effects to get a signal free of possible distortive elements that helps to calculate more accurately the cyclical component of the economy. In the case of the series from the Quarterly National Accounts, they are already published corrected of such effects. For the remaining time series, Tramo–Seats is used (Caporello and Maravall 2004).Footnote 12
Formally:
where \( xr_{j.t} \) is the raw indicator and \( x_{j.t} \) the corrected indicator; V() is the Wiener–Kolmogorov filter symmetrically defined on the backward and forward operators B and F and θi,j are the parameters of the filter derived consistently with those of the ARIMA model for \( xr_{j.t} \), see Gómez and Maravall (1998) for a detailed exposition of the model-based approach used by Tramo–Seats.
All series have been extended and/or completed until the first quarter of 1980, considering their specificities (sources, concepts, different statistical bases, mixed frequencies, etc.). The sample ends in 2016Q4.
Overall, the necessary processing could be summarized by backward linking retropolation and temporal disaggregation when needed.Footnote 13 Moreover, additional benchmarking techniques are implemented whenever the seasonal adjustment process breaks the temporal consistency with respect to the annual reference.
Finally, there are three main issues to set before performing the estimation of the different combinations: (a) the cyclical behavior of the selected variables, accompanying the GDP; (b) their order of integration; and (c) unit specification.
4.2 Selection results
The selection of the relevant variables follows a reductionist approach according to the criteria specified above, starting with the necessary conditions. In this context, reductionist means that the complete list of potential variables is pruned through a specification process to derive a shorter list that will form the basis for the final econometric model. Every variable is modelled in a bivariate framework together with real GDP.
In the first place, the candidates not passing the significance test are removed, as can be seen in Table 2. Two sets of variables are left out in this first round, most labour market series and somewhat surprisingly, financial variables. Although highly intertwined in the latest crisis, financial and domestic demand variables tend to follow different cyclical patterns. Indeed, the literature has identified longer financial cycles, particularly as the deleveraging process of overindebted economies takes time and is still present after the economy is fully on track.
The average revision indicator provides the second screening for the remaining variables. This indicator reflects the average gap between the filtered (one-sided) and smoothed (two-sided) estimates of the output gap, normalized by the maximum range of the filtered estimation. Variables experimenting large revisions relative to their volatility are thus penalized (e.g. public debt, housing prices). The defining threshold is set at 0.25, to include two-thirds of the remaining sample. Third, goodness of fit is assessed in relative terms as the ratio between the average standard error and the maximum range of the filtered estimate. Again, the threshold is set to keep two-thirds of the competing variables (at 0.4). Prices and monetary variables are discarded at this stage as can be seen in Table 2.
Once the necessary conditions are checked out, the fourth criterion looks at the amplitude and profile of the output gap estimates. Small cycles, as defined by a small amplitude (lower than 4 pp.) are first left out. These include productive investment and most of the remaining fiscal variables (net income, social security contributions, direct and indirect taxes). A closer look at the specific profiles and ECRI dating allows for a further screening by removing unemployment benefits (as it does not properly identify the beginning of the last cycle) and capacity utilization (as it advances the recovery after the last cycle and points to positive output gap figures already in 2016).
Only three candidates made it all the way down to the fourth criteria: (i) the unemployment rate; (ii) the current account balance over GDP; and (iii) investment in construction over GDP.
4.3 An estimate for Spain
4.3.1 Bivariate models
The estimation of bivariate models including GDP and each one of the selected candidate variables yields additional information on the shape and the extent of the cycle, as well as insights on the stability of the estimates. Thus, bivariate models operate as a pairwise, useful screening device for the complete multivariate model but the estimates of their parameters do not condition in any way the estimation of the corresponding parameters of the multivariate model.
The stability of the estimates is assessed via a backward test covering the last 40 quarters, and results are obtained for the cyclical parameter as well as for the output gap estimates (see Fig. 3). As can be seen in the left-hand panels of Fig. 3, parameter stability remains rather high, although with some discontinuities in the unemployment coefficient. This reassuring result would ensure robustness in the estimates as new data becomes available.

Source of data: author’s estimations
Backtest, selected variables. a Recursive coefficient, unemployment cycle, b recursive output gap, unempl. model, c recursive coefficient, current account cycle, d recursive output gap, curr. acc. model, e recursive coefficient, construction cycle, f recursive output gap, construction model.
This pseudo-real time exercise translates into updated output gap estimates as new data points are added to the sample (see right-hand side of Fig. 3). A general pattern emerges in all three cases as new observations are considered: the peak of the last cycle is revised upwards and the trough is equally revised downwards, thus amplifying the extent of the crisis and delaying the closure of the output gap. These results are particularly relevant as they point towards structural gains associated with the latest economic developments.
4.3.2 Economic interpretation
The economic narrative also supports the interpretation of the current slack in the economy being rather large and with a slow reversion towards a balanced state.
In particular, the current growth pattern is proving to be resilient and balanced. Growth is more export-oriented and deleveraging in the private sector is co-existing with a robust productive investment and strong employment creation without generating inflationary or wage pressures.
The correction of the macro imbalances has thus a significant structural component. As can be seen in Fig. 4, unemployment is being cut back with historically low real growth figures, while this has not generated additional imbalances or tensions in terms of current account deficit or excessive construction investment.

Source: INE, Bank of Spain
Selected variables over the last cycle.
The identification of a new growth pattern has important fiscal implications going ahead. Cyclical fluctuations do not have a constant impact on the budget balance as the response (elasticity) of fiscal revenues to growth is ultimately affected by compositions effects, as shown in Bouthevillain et al. (2001) and Bénétrix and Lane (2015). For example, when growth is more export-oriented, VAT revenues will respond less prociclically.
4.3.3 A final multivariate estimate
When turning from the bivariate to the full model set-up, which includes GDP altogether with the three selected variables, the transition is far from smooth. Collinearity amongst the cyclical components can potentially generate imprecise point estimates that, combined with a flat likelihood function, may cause “jumps” in the estimations, rendering output gap estimates unstable.Footnote 14
In particular, instability is directly related with the estimates of the autoregressive dynamics of the cyclical component of GDP (\( \phi \) parameters in Eq. 4). A practical and operational fix consists in incorporating additional information in the estimation process. For this purpose, model averaging through the more stable bivariate estimates is performed.Footnote 15
The final estimation of the model by maximum likelihood using the complete sample is presented in Table 3. The parameter estimates (α) confirm the procyclical behaviour of the residential investment and the strongly anticyclical pattern of the unemployment rate and the current account balance. At the same time, the estimated parameters of the common cycle component (\( \phi \) in the output gap equation) show a characteristic hump-shaped impulse-response function as well as a spectrum heavily concentrated in the low frequencies range, confirming that the output gap can be better characterized as recurrent fluctuations rather than strictly periodic oscillations.
The log likelihood of the model is 4399.03 and the diagnostics for the measurement errors of the model display no evidence of systematic structure, as shown by the lack of significative autocorrelation. At the same time, the large kurtosis observed in all the variables except GDP, points towards some variance instability that precludes the Gaussian nature of the measurement errors. Finally, the lack of structure of the squared errors does not suggest the existence of non-linear significative effects that may jeopardize the fit of the (linear) model (Table 4).
Figure 5 presents the multivariate output gap estimate, both one-sided and two-sided or smoothed, together with ECRI dating of the business cycle and a reference of external estimates.Footnote 16

Source of data: author’s estimations
Spanish output gap, multivariate estimate.
The final results present several benefits, easily passing the “smell test”. First, the estimate is in accordance with official recession dating, providing thus sensible turning point signals. Second, it is well aligned with external estimations, although some of them are two-sided filters and thus include additional information. Third, it is highly reliable in real-time as the revisions are rather limited. Fourth, the expert judgement of its characterization of the last cycle seems appropriate, with an exceptional boom-bust episode, larger than initially thought, as can be seen through the comparison between the corresponding one-sided and two-sided estimates.
Finally, as an important bi-product, the model allows for a split of the observed variables in their cyclical and structural components (see Fig. 6). This decomposition is particularly useful in order to ascertain the relative strength of both components and to define a consistent narrative of business cycle facts. For example, inefficiencies in the labour market translate into a high structural rate of unemployment (around 15%), despite large swings in the cyclical component during the last boom-bust episode. Moreover, the correction in the current account balance since its trough in 2007 has been the result of a strong initial cyclical adjustment but also, since 2010, of a significative rebalancing of its structural component which is now close to historical maximum values. Finally, the behavior of investment in construction is dominated by a hybrid pattern that combines a cyclical downturn without historical precedents with a structural correction to a value around 3 pp lower than the pre-crisis average. To what extent this decline is permanent is debatable but, if it is not, gives a certain margin for the recovery to this variable.

Source of data: author’s estimations
Decomposing the observed variables.
5 Conclusions
Over the last decades, the estimation of the slack in the economy has become an essential piece of analysis for policymakers, both on the monetary and the fiscal policy side. Output gap estimation techniques have flourished accordingly, although there is no consensus on a best-performing methodology, as the selection criteria often imply important trade-offs.
This paper presents a novel approach putting the focus on the specification of the model (“beauty contest” amongst candidate variables) rather than on a prior selection of the methodology itself (model “horse race”). Ideally, an agreeable method should achieve three necessary conditions: economic soundness, statistical goodness and transparency. On top of this, a sufficient condition for its final estimate of the cycle is given by the smell test, often implemented by policymakers. In practice, fulfilling these conditions can prove to be challenging.
Multivariate methods, coupled with Kalman filtering are generally considered amongst those reaching an acceptable level of compromise between these dimensions and thus are selected as a starting point, allowing for a combination of an economically-sound specification with a well-tested and flexible econometric procedure. The method serves as a compromise as it fulfils the necessary criteria and allows for enough flexibility to get a country-specific approximation to the sufficient (smell test) criteria as it could accommodate specific cycles (financial, external, investment, fiscal, etc.). This somewhat eclectic approach is illustrated with its application to a data set for the Spanish economy, by selecting the best model amongst combinations of GDP and 52 accompanying variables.
Some preliminary conclusions can be drawn at this stage. First, there are some technical aspects related to the specification of the variables that are important to be taken care of before jumping into the estimation, such as: (i) modeling of GDP as an integrated process of order 1 or 2; (ii) definition of the cyclical interactions (e.g. are all the cyclical components contemporaneous with the output gap?); (iii) transformation of the series (nominal vs. real, ratios vs. logs, etc.). Second, there is no clear algorithm for the selection of the variables to be included in the final specification. Should it be an incrementalistic approach or rather a brute force consideration of all the alternative combinations? Third, this paper has opted for the definition of necessary versus sufficient conditions, although other combinations or weighting of the criteria might be possible.
Finally, future extensions of this work include an attempt at answering some of these open questions and providing a full assessment of the methodology in more complex data environments as well as technical improvements adding to the existing selection criteria, for example by estimating the contribution of the observables to the estimation of the output gap, along the lines exposed by Koopman and Harvey (2003).
Notes
See for example Cotis et al. (2005) and references within for a complete discussion.
In the Spanish case, GDP can be modeled following an I(1) structure plus a highly persistent Markov-switching drift, as shown in Cuevas and Quilis (2017). This specific structure can be linearly approximated by a random walk plus an evolving AR(1) drift.
This function solves non-linear, unconstrained optimization programs. See “Appendix A” for details.
A large number of backasts are generated to produce an effective desensitization. The numerical implementation considers a number around 0.65T, being T the number of available observations.
When forecasts for t + 1, t + 2, etc. are considered, they can be considered as extrapolations of the information available at time t rather than genuine observations.
In order to integrate the whole estimation process and to be able to consider the different variable combinations, an Excel platform has been designed that integrates the database, the estimation functions in Matlab and a stability analysis (backtest).
Economic Cycle Research Institute recession dating: https://www.businesscycle.com/ecri-business-cycles/international-business-cycle-dates-chronologies.
Data limitations prevent us to perform a true real time exercise, including the impact of revisions of the raw data as well as revisions due to the (two-sided) seasonal adjustment filter. Thus, strictly speaking, the exercise must be considered as a pseudo-real time one.
Non-accelerating inflation and stabilizing external sector rate of unemployment: NAIRUE.
Apart from the numerical implementation of the maximum likelihood estimation, our approach may be considered as a simple yet flexible approach for a specification search whereas Doménech and Gómez is more focused on providing an econometric model for a set of key macroeconomic relationships (Okun’s law, Phillips curve and the cyclical co-movement between investment and output).
The use of symmetric filters for seasonal adjustment introduces an additional source of revisions in the output gap estimates.
This interaction may explain the instability of the estimated model parameters that underlie the instability of the output gap estimate although the exact nature of the problem requires more extensive research.
As can be seen in “Appendix B”, the constraints ensure the cyclical nature of the model as well as make more persistent its impulse response function.
Min–Max range including Spanish Ministry of Economy, European Commission, OECD and IMF estimations.
See Abad and Quilis (2004) for a detailed exposition of the algorithm. We have used a univariate interpolator to construct monthly output gap estimates that can be processed by the algorithm.
References
Abad A, Quilis EM (2004) Programs for cyclical analysis. User’s guide. National Statistical Institute, Sofia
Alberola E, Estrada A, Santabárbara D (2013) Growth beyond imbalances. Sustainable growth rates and output gap reassessment, Bank of Spain, working paper no. 1313
Alichi A (2015) A new methodology for estimating the output gap in the United Sates, IMF working paper series, working paper no. 144
Álvarez LJ, Gómez-Loscos A (2017) A menu on output gap estimation methods, Bank of Spain, working paper no. 1720
Bénétrix AS, Lane PR (2015) Financial cycles and fiscal cycles. Trinity economics papers tep0815, Trinity College Dublin, Department of Economics
Boot JCG, Feibes W, Lisman JHC (1967) Further methods of derivation of quarterly figures from annual data. Appl Stat 16(1):65–75
Borio C, Disyatat P, Juselius M (2017) Rethinking potential output: embedding information about the financial cycle. Oxford Economic Papers 69(3):655–677
Bouthevillain C, Cour-Thimann P, Van den Dool G, De Cos PH, Langenus G, Mohr MF, Momigliano S, Tujala M (2001) Ciclically adjusted budget balances: an alternative approach, ECB working paper no. 77
Caporello G, Maravall A (2004) Program TSW. Revised manual, Bank of Spain, occasional paper no. 0408
Chow G, Lin AL (1971) Best linear unbiased distribution and extrapolation of economic time series by related series. Rev Econ Stat 53(4):372–375
Clark T (1987) The Cyclical Component of U.S. Economic Activity. Quart J Econ 102(4):797–814
Cotis JP, Elmeskov J, Mourougane A (2005) Estimates of potential output: benefit and pitfalls from a policy perspective. In: Rechling L (ed) Euro area business cycle: stylized facts and measurement issues. CEPR, Washington DC
Cuevas A, Quilis E (2017) Non-linear modelling of the Spanish GDP, AIReF working paper, no. 17/01
Doménech R, Gómez V (2006) Estimating potential output, core inflation, and the NAIRU as latent variables. J Bus Econ Stat 24(3):354–365
Doménech R, Estrada A, González-Calbet L (2007) Potential growth and business cycle in the Spanish economy: implications for fiscal policy, Working paper no. 05, International Economics Institute, University of Valencia
Durbin J, Koopman SJ (2001) Time series analysis by state space methods. Oxford University Press, Oxford
Estrada A, Hernández de Cos P, Jareño J (2004) Una estimación del crecimiento potencial de la economía española, Bank of Spain, ocassional paper no. 0405
Fernández RB (1981) Methodological note on the estimation of time series. Rev Econ Stat 63(3):471–478
Gómez V, Maravall A (1998) Guide for using the programs TRAMO and SEATS, Bank of Spain working paper no. 05
Harding D, Pagan A (2006) Synchronization of cycles. J Econom 132:59–79
Harvey AC (1989) Forecasting, structural time series models and the Kalman filter. Cambridge University Press, Cambridge
Kim CJ, Nelson CR (1999) State space models with regime switching. MIT Press, Cambridge
Kitagawa G, Gersch W (1996) Smoothness priors analysis of time series. Springer, Berlin
Koopman SJ, Harvey AC (2003) Computing observation weights for signal extraction and filtering. J Econ Dyn Control 27(7):1317–1333
Kuttner KN (1994) Estimating potential output as a latent variable. J Bus Econ Stat 12(3):361–368
MathWorks (2016) Optimization toolbox. The MathWorks, Inc., Natick
Murray J (2014) Output gap measurement: judgement and uncertainty, U.K. Office for Budget Responsibility, working paper no. 5
Author information
Authors and Affiliations
Corresponding author
Additional information
Publisher’s Note
Springer Nature remains neutral with regard to jurisdictional claims in published maps and institutional affiliations.
We are grateful to the editor and the referees for their comments and suggestions that greatly improved the paper. We would like to thank Ana Andrade for extensive research assistance and Daniel Santabárbara for fruitful discussions and insights. R. Doménech, J.L. Escrivá, R. Frutos, L. González-Calbet, M. Juselius and P. Poncela provided valuable comments. Any views expressed herein are those of the authors and not necessarily those of AIReF.
Appendices
Appendix A: Kalman filter
In this “Appendix”, we present the algorithms used to implement the Kalman filter. The first one is used to compute the likelihood of the model and the one-sided (concurrent) estimates of the state vector (point estimate and standard error). The second algorithm is used to derive the two-sided (historic, smoothed) estimates of the state vector (point estimate and standard error). The exposition follows closely Kim and Nelson (1999).
1.1 A.1. Concurrent Kalman filter (CKF)
Assuming as given the parameters THETA and the initial condition S(0), the algorithm can be stated as follows:

Notes:
-
The dimension of the state vector is k.
-
The effect of the diffuse prior for the initial conditions is tampered through the backcasting procedure explained in the main text.
-
The optimization that yields the maximum likelihood estimates includes constraints on the model parameters that ensure its statistical adequacy (i.e. positive estimates for the variances, AR(2) parameters in the stationary range).
-
We have used the fminunc function from the Matlab’s Optimization Toolbox, see MathWorks (2016). The specific options used are:
-
Termination tolerance on the function value: 1e-8.
-
Termination tolerance on X (input): 1e-8.
-
Maximum number of function evaluations allowed: 2000.
-
1.2 A.2. Smoothed Kalman filter (SKF)
Assuming as given the parameters THETA and the one-sided estimates of the state vector and its VCV matrix, the smoothing algorithm can be stated as follows:

1.3 A.3. Complete implementation of the Kalman filter
The implementation of the Kalman filter used in the paper can be summarized as follows:
-
Maximum likelihood estimation of the θ parameters of the model. Concurrent Kalman filter (CKF) is used to compute the likelihood. CKF runs from 1 to T (forward mode).
-
State-space equations are run in reversed (backward) mode to generate backasts for the observed variables. In this way, we de-sensitize the estimates of the state vector from the initial conditions.
-
CKF runs from − Tb to T (forward mode), yielding one-sided estimates for the state vector, thus including output gap.
-
SKF runs from T to 1 (backward mode), yielding two-sided estimates for the state vector.
Appendix B: Statistical features of output gap estimates
In this “Appendix” we analyze the main properties of the output gap estimates as derived from the model estimates presented in the main section of the paper.
-
Unconstrained estimation
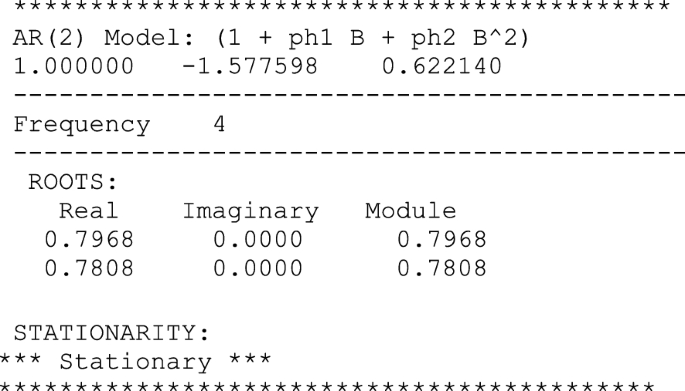

The unconstrained estimates are stationary although they lack a defined oscillatory structure. Note also the boundary nature of the estimates, see the Stralkowskis’ triangle in Fig. 7. However, these facts do not preclude the existence of fluctuations, as can be seen when examining the hump-shaped form of the impulse-response of the AR(2) filter.

Features of the AR(2) estimates. Unconstrained case
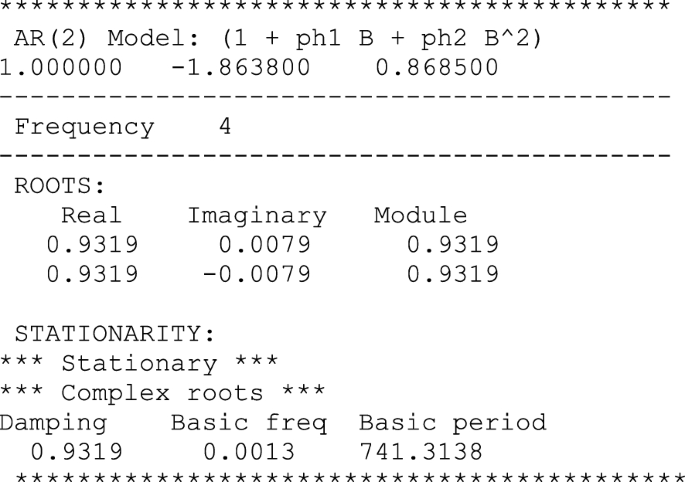
The constrained estimation ensures the cyclical nature of the output gap estimates, although the periodicity of the underlying cycle is quite high. In this way, the constrained estimates show a high degree of persistence being still quite close to the boundary between the cyclical region and the monotonic region of the corresponding Stralkowskis’ triangle, see Fig. 8.

Features of the AR(2) estimates. Constrained case
-
Constrained estimation

Finally, we can use a dating algorithm à la Bry–Boschan to generate a detailed chronology of the output gap estimates.Footnote 17 The results suggest the existence of a fairly long cycle (around 11 years on a peak-trough-peak basis) that yields a reduced number of turning points (4), confirming the persistent and long-lasting nature of the fluctuations revealed by the gain functions depicted in Fig. 8 (Table 5).
Rights and permissions
Open Access This article is distributed under the terms of the Creative Commons Attribution 4.0 International License (http://creativecommons.org/licenses/by/4.0/), which permits unrestricted use, distribution, and reproduction in any medium, provided you give appropriate credit to the original author(s) and the source, provide a link to the Creative Commons license, and indicate if changes were made.
About this article

Cite this article
Cuerpo, C., Cuevas, Á. & Quilis, E.M. Estimating output gap: a beauty contest approach. SERIEs 9, 275–304 (2018). https://doi.org/10.1007/s13209-018-0181-5
Received:
Accepted:
Published:
Issue Date:
DOI: https://doi.org/10.1007/s13209-018-0181-5